· Weekly signal · HOOD
Robinhood Markets Inc (HOOD) weekly rally stretches despite thin confirmation
A 52-week weekly view shows the retail broker’s rebound spanning more than the latest print, while technical and volume signals remain uneven.
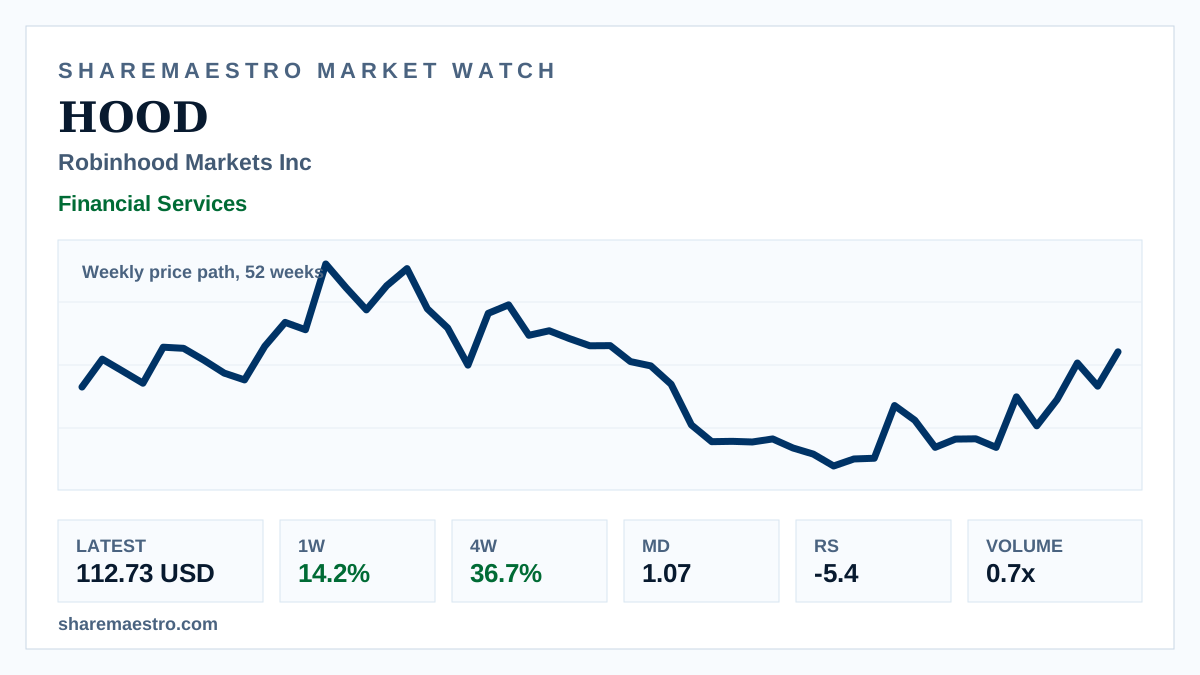
Robinhood Markets Inc (HOOD) closed the latest week at $112.73 as weekly market data showed a 14.2% advance for the capital-markets stock.
The weekly price path over 52 weeks points to a broader rebound, with gains still positive across the four-week and twelve-week windows. Confirmation is mixed, as the trend signal is inactive and latest turnover trails the 13-week average.