· Weekly signal · FTI
TechnipFMC PLC (FTI) builds 19.1% four-week advance in weekly context
The oilfield-services stock’s latest weekly close shows momentum improving, though Market Dynamics still points to pressure beneath the move.
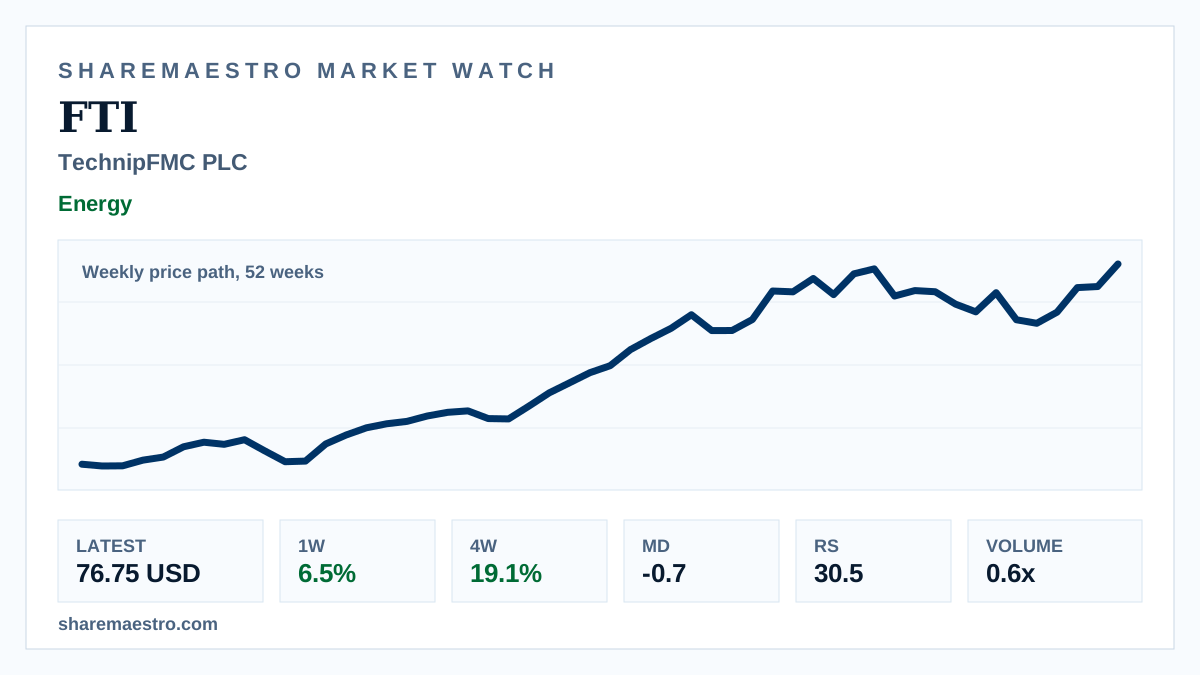
TechnipFMC PLC (FTI) closed the latest week at 76.75 USD, up 6.5% for the week and 19.1% over four weeks. The weekly price path over 52 weeks shows the Energy stock back in an active trend state after a strong July stretch.
Confirmation is not clean. The twelve-week return is only 1.3%, Relative Strength is 30.5, and Market Dynamics remains negative at -0.7, signaling lingering pressure rather than broad support. Weekly turnover on the active-mover screen was near 1.0x, so the move was not backed by a major volume surge.