· Weekly signal · TSEM
Tower Semiconductor Ltd (TSEM) catches weekly bid as trend pressure stays positive
The semiconductor foundry’s latest weekly move adds to a broader advance, but lighter turnover keeps the evidence mixed.
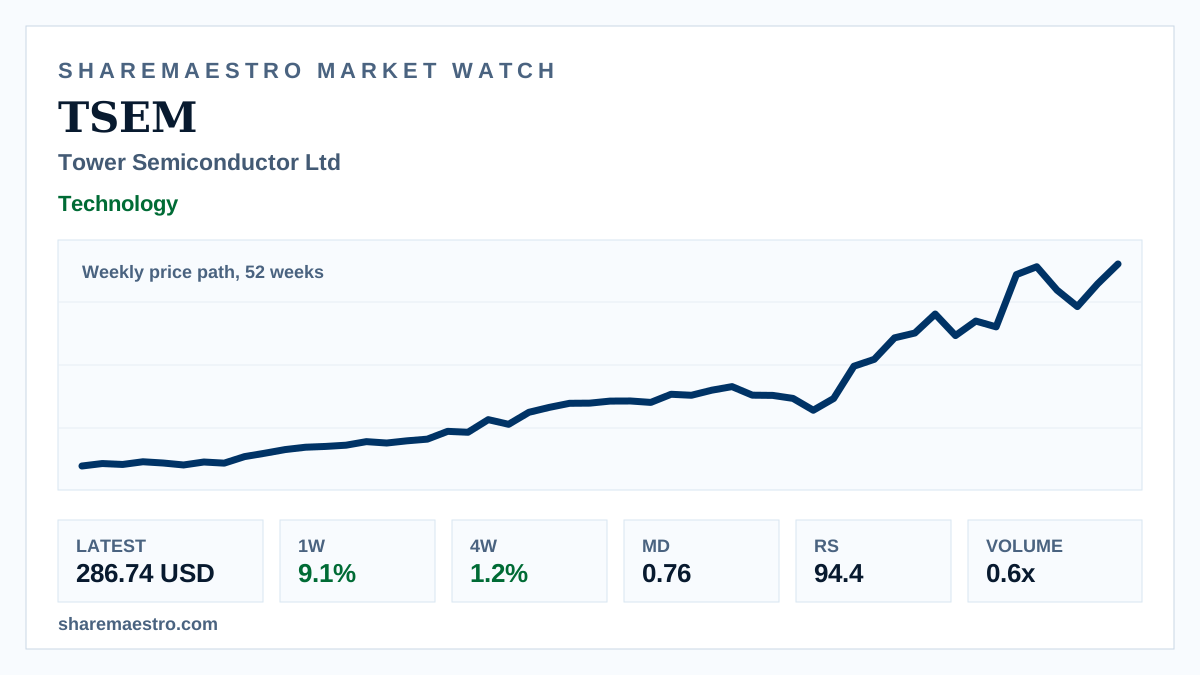
Tower Semiconductor Ltd (TSEM) closed the latest week at $286.74, up 9.1%, putting the mixed-signal foundry back on the active-mover screen. The chart shows a weekly price path over 52 weeks, so the setup reflects weekly context rather than live intraday trading.
Confirmation is constructive but not clean. The trend signal is active and Relative Strength stands at 94.4, while Market Dynamics shows positive pressure at 0.76; against that, weekly volume ran below its recent average.