Weekly Price
Weekly Close, Trend Line, Activity Lines, Fair Value, volume and trend state context.
VIE visual research bundle
Flughafen Zürich AG
A printable Sharemaestro chart pack for FHZN covering weekly price, trend structure, Market Dynamics, Smart Money, SMI, Price Cycle, Relative Strength, Fair Value and next-state context.
Over the latest 12 completed weeks ending 2026-07-10, FHZN rose 7.25%, moving from 248.20 to 266.20. The latest weekly close is above the Trend Line and above Fair Value. Trend Signal is inactive on the latest week and was active in 0 of the last 12 weeks. Market Dynamics is 0.09 on the latest week. Next-week expectancy is positive at 57.08% based on similar historical setup states.
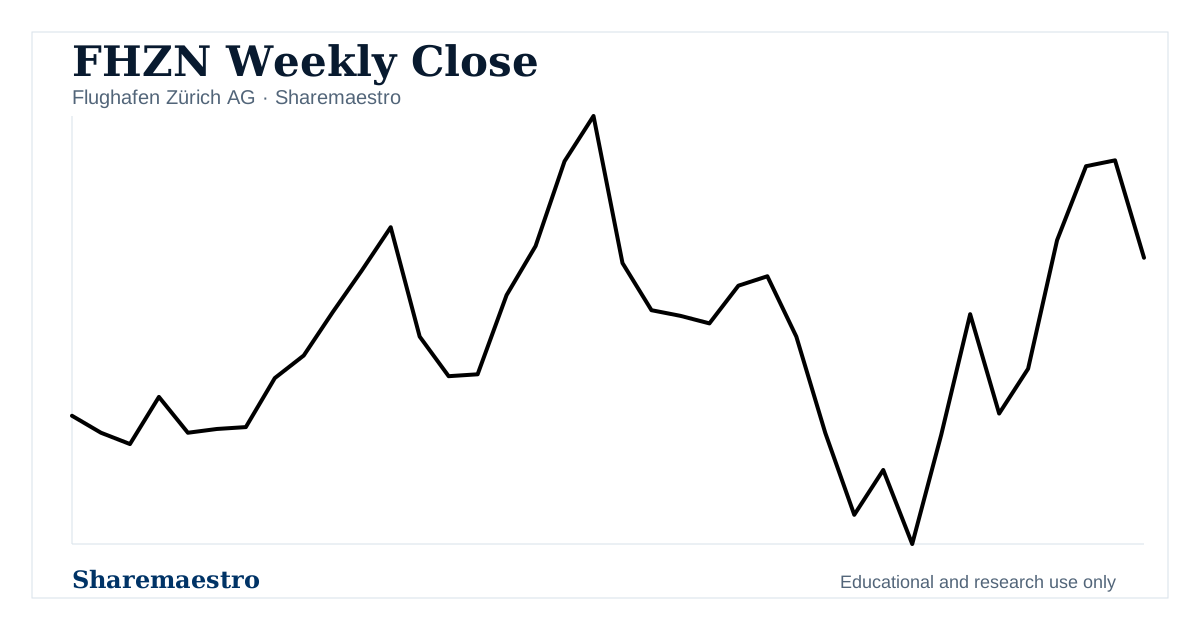
The downloadable PDF renders each chart view individually, in the same order as the interactive chart workspace.
Weekly Close, Trend Line, Activity Lines, Fair Value, volume and trend state context.
Market Strength, activity momentum, ribbon pressure, relative strength and rate-of-change panels.
Smart money background bars and trend state overlays for the weekly chart.
Momentum, demand threshold, accumulation, buy signals and market cycle context.
Market Price Cycle deviation, activity line, trend line and signal markers.
Recent weekly candlesticks, trend line, pivotal level and volume context.
Historical transition map for similar setup states and next-week expectancy.
Use the PDF when you want the whole FHZN chart workspace as one portable chart pack. For live interaction, indicators and related research links, use the canonical ticker chart page.
Search by ticker symbol or company name and select a result to open its chart.