· Weekly signal · AMD
Advanced Micro Devices Inc (AMD) pullback tests a 42.5% 12-week surge
The chip stock fell sharply on the week, but the broader 52-week weekly chart context still shows a strong recent advance.
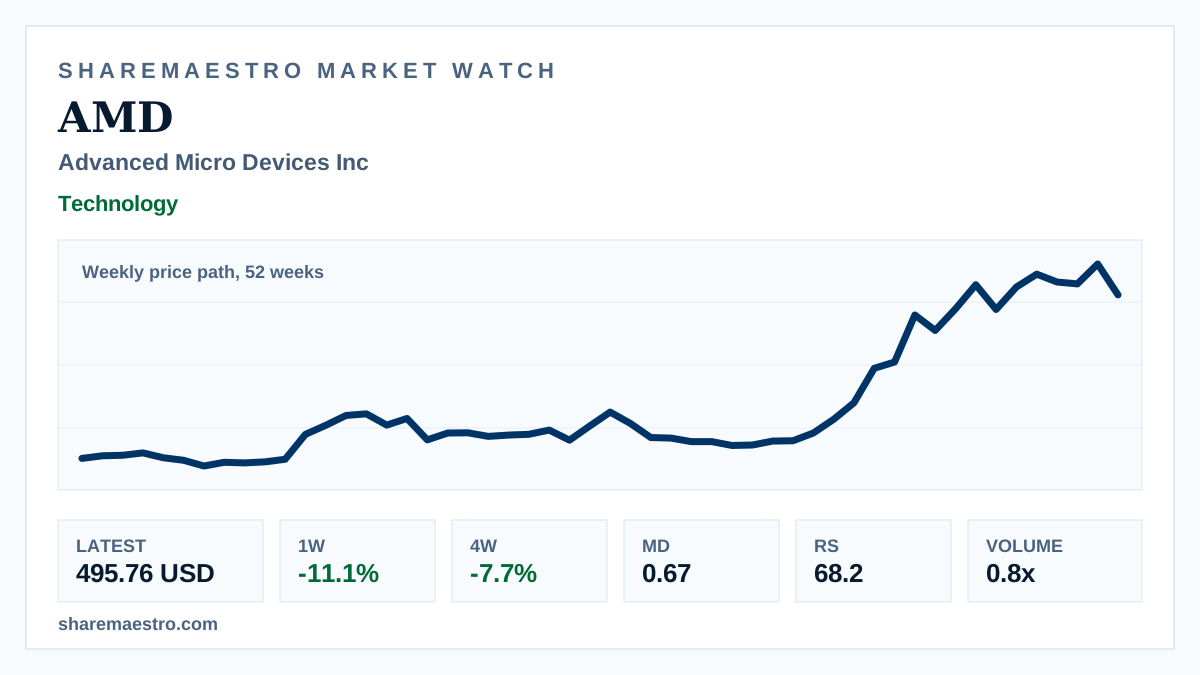
Advanced Micro Devices Inc (AMD) closed at 495.76 USD in the latest weekly reading, down -11.1% for the week and -7.7% over four weeks. The move marks a sharp reset after a 42.5% twelve-week gain.
Confirmation is mixed. The trend signal remains active and Relative Strength is 68.2, but Market Dynamics at 0.67 shows only moderate confirmation. Weekly volume was near normal on the active-mover screen, with the local volume ratio at about 1.0x.