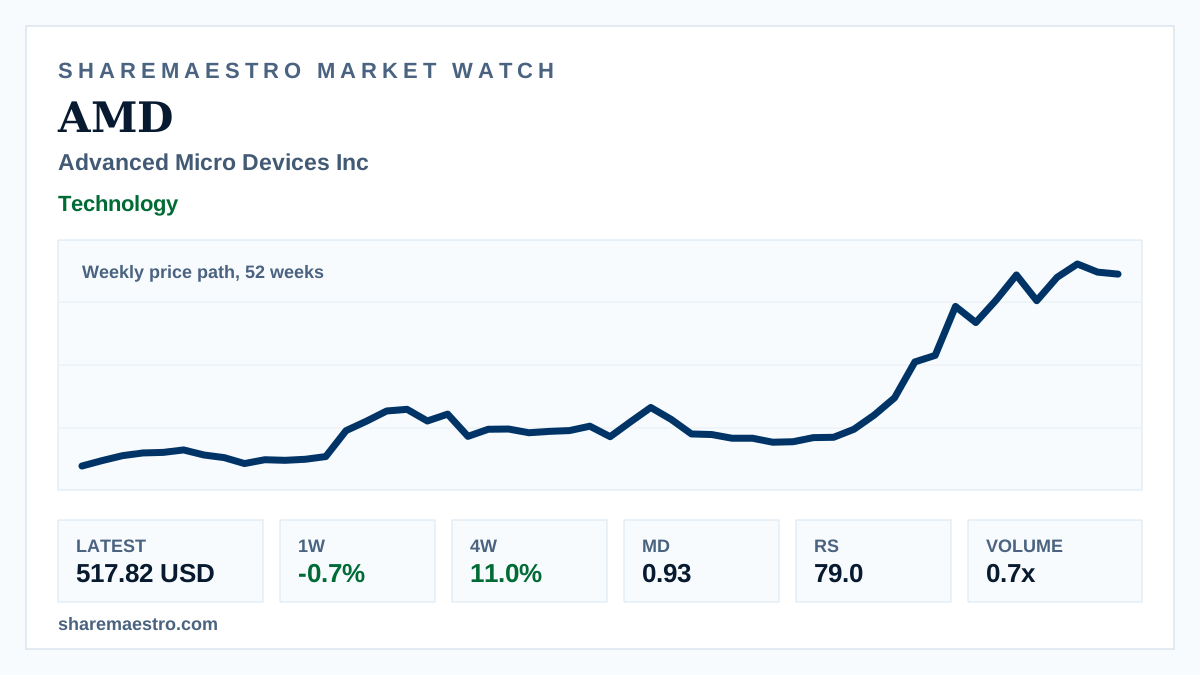
Weekly signal ยท AMD ยท Technology

Advanced Micro Devices Inc (AMD) weekly advance pauses after a sharp 12-week run

The semiconductor stock held an active trend profile, but the latest week showed a loss of momentum on lighter turnover.

Latest517.82 USD
1W move-0.7%
Volume0.7x
TrendActive
Weekly market chart for Advanced Micro Devices with semiconductor chips and wafers.
Supporting market chart for Advanced Micro Devices Inc (AMD) weekly advance pauses after a sharp 12-week run

Market update

What happened

Advanced Micro Devices Inc (AMD) closed the week ended July 3 at 517.82 USD, down -0.7% for the week after an 11.0% four-week advance.

In weekly context over 52 weeks, the trend signal remains active, with Market Dynamics at 0.93 providing confirmation and Relative Strength at 79.0. Trading volume was 117.7 million shares, below the 13-week average of 175.7 million, leaving evidence supportive but not uniformly strong.

Continue your research

Explore AMD across Sharemaestro

These links are shown because current Sharemaestro data is available for this company.

Evidence context