· Volume surge · GFS
Globalfoundries Inc (GFS) weekly slide cuts into an 82.4% 12-week run
A flat four-week return and mixed volume evidence make the foundry stock’s latest move less straightforward than the longer-term chart suggests.
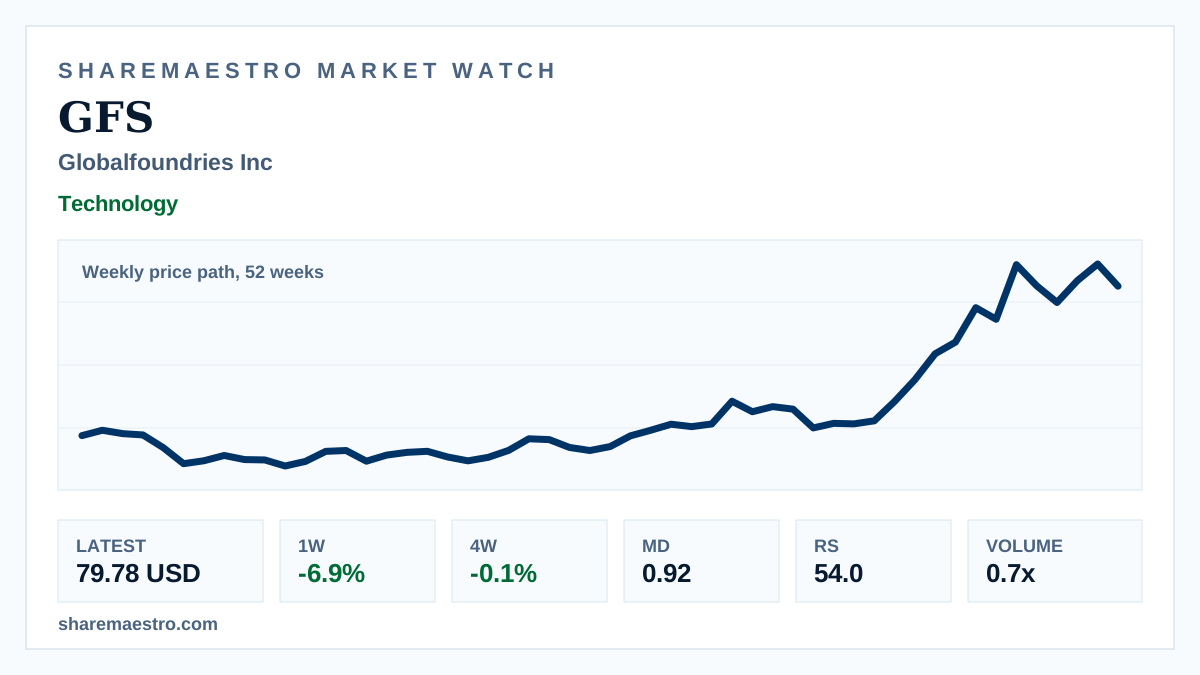
Globalfoundries Inc (GFS) closed the latest week at $79.78, posting a -6.9% one-week return in weekly market data. The chart is a weekly price path over 52 weeks, so the move marks a weekly reset rather than live intraday action.
The evidence is mixed. The four-week return is -0.1%, while the twelve-week return remains 82.4%; the trend signal is active and Market Dynamics at 0.92 show confirmation, but Relative Strength at 54.0 is only moderate. Volume also cuts both ways, with the active-mover screen showing 1.8x turnover even as weekly share volume of 16.8 million was below the 22.5 million 13-week average.