Sharemaestro Live Desk

Market Watch

Concise live market research from price action, volume, signals, sector context, earnings setup, and unusual activity.

· Volume surge · HII · Industrials

Huntington Ingalls Industries (HII) volume jumps as weekly gain reaches 13.5%

The U.S. military shipbuilder’s rebound has firmed over the past month, but trend and relative-strength readings are not fully aligned with the price move.

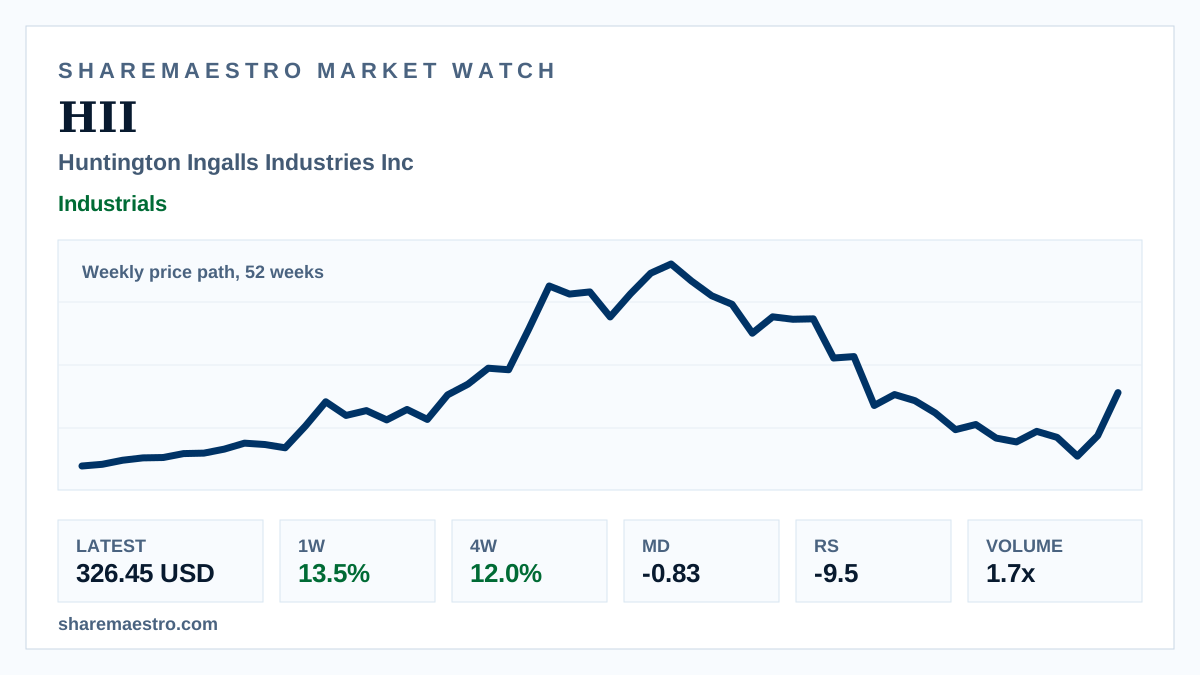
Huntington Ingalls Industries (HII) closed the latest week at 326.45 USD, rising 13.5% on the week and extending its four-week advance to 12.0%. The active-mover screen also flagged volume at 2.2x, putting the defense shipbuilder among the week’s more active industrial movers.

The weekly price path over 52 weeks shows a sharp recent recovery rather than broad, steady confirmation. Market Dynamics remained under negative pressure at -0.83, the trend signal was inactive, and Relative Strength stood at -9.5, leaving the evidence mixed despite the price acceleration.

  • Latest close: 326.45 USD.
  • Four-week return: 12.0%; twelve-week return: 3.7%.
  • Weekly volume was 4.47 million shares versus a 13-week average of 2.65 million.
  • Market cap was about $12.5 billion in the Industrials sector.
  • Market Dynamics: -0.83; Relative Strength: -9.5.
Weekly market chart context for Huntington Ingalls Industries alongside a naval shipbuilding scene.
Weekly market chart concept for Samsara Inc with connected-operations software and market data screens.

· Weekly signal · IOT

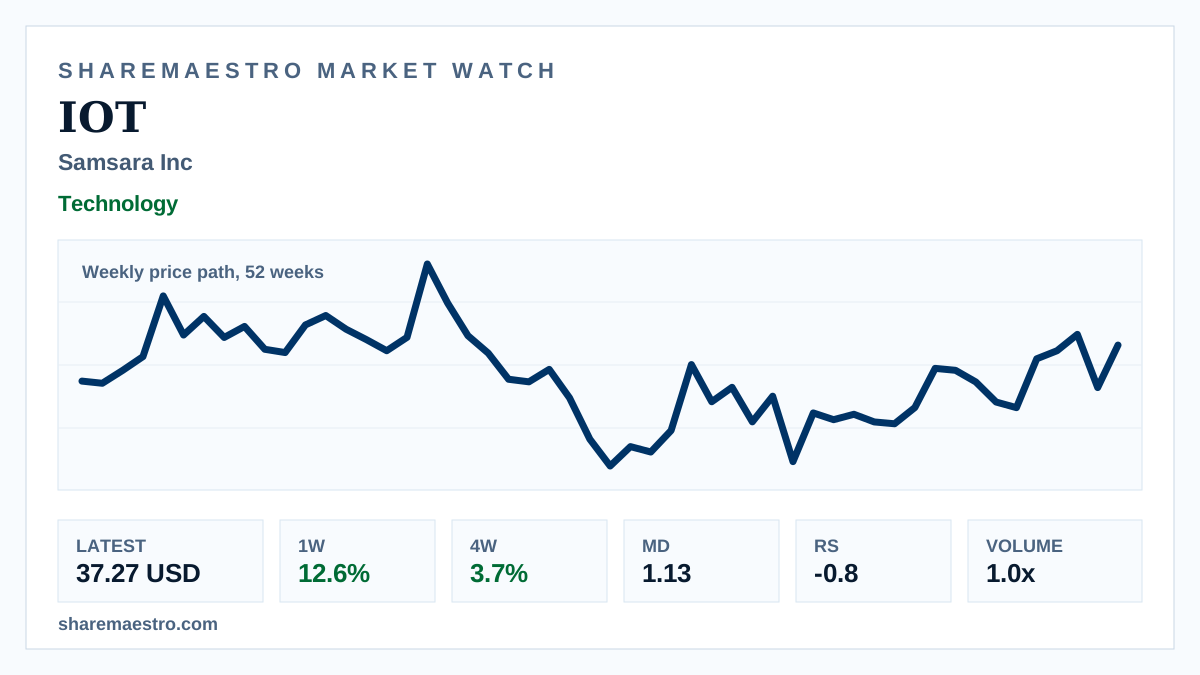
Samsara Inc (IOT) keeps twelve-week advance intact at 25.3%

The software-infrastructure stock has an active trend and slightly above-average activity, but relative strength remains a modest complication.

  • One-week return: 12.6%; four-week return: 3.7%.
  • Twelve-week return: 25.3%, keeping the broader weekly move positive.
  • Weekly volume was 30.3 million shares, or about 1.0x the 13-week average.
Semiconductor wafers and chips representing NXP Semiconductors beside a finance screen.

· Volume surge · NXPI

NXP Semiconductors NV (NXPI) comes under renewed weekly pressure

The semiconductor stock’s 52-week weekly price path shows recent weakness broadening, with heavier activity adding weight to the move.

  • Latest weekly close: 229.16 USD.
  • Returns: -14.9% one week, -16.2% four weeks, -22.0% twelve weeks.
  • Weekly volume: 32.3 million shares versus a 13-week average of 20.4 million.
BP refinery operations with financial market screens in the foreground.

· Earnings watch · BP

BP PLC ADR (BP) approaches results with a 20.9% four-week rebound

The integrated energy ADR reports this week with its 52-week weekly price path showing a late-July recovery, though momentum evidence is not uniformly positive.

  • Latest weekly close: $45.22 on July 31.
  • One-week return: 3.2%; twelve-week return: 5.5%.
  • Latest volume was 46.3 million shares, or 1.08 times the 13-week average.
Sandisk storage hardware displayed beside a weekly market chart on a finance terminal.

· Volume surge · SNDK

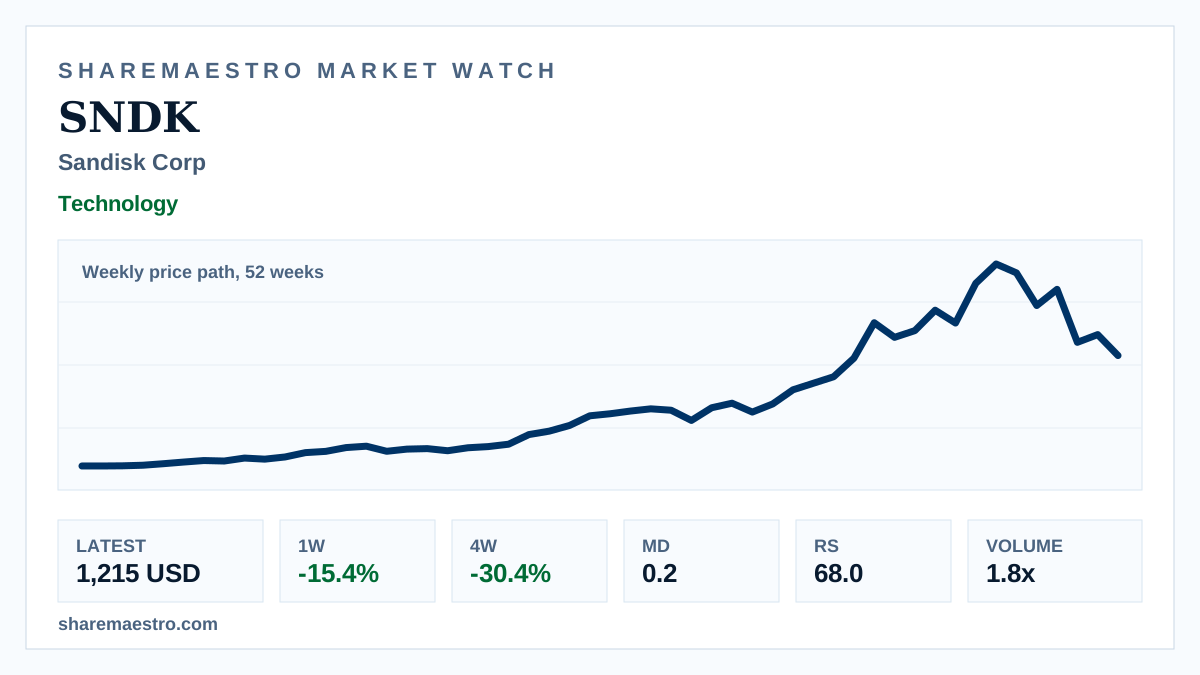
Sandisk Corp (SNDK) weekly selloff accelerates on 1.8x volume

The storage-hardware name is under broad weekly pressure, with the 52-week chart showing losses across the one-, four- and twelve-week windows.

  • Latest weekly close: 1,215 USD.
  • Weekly return: -15.4%; four-week return: -30.4%; twelve-week return: -22.2%.
  • Latest weekly volume was 117.97 million shares versus a 13-week average of 66.17 million.
Finance chart and digital banking visual representing SoFi Technologies market activity.

· Intraday mover · SOFI

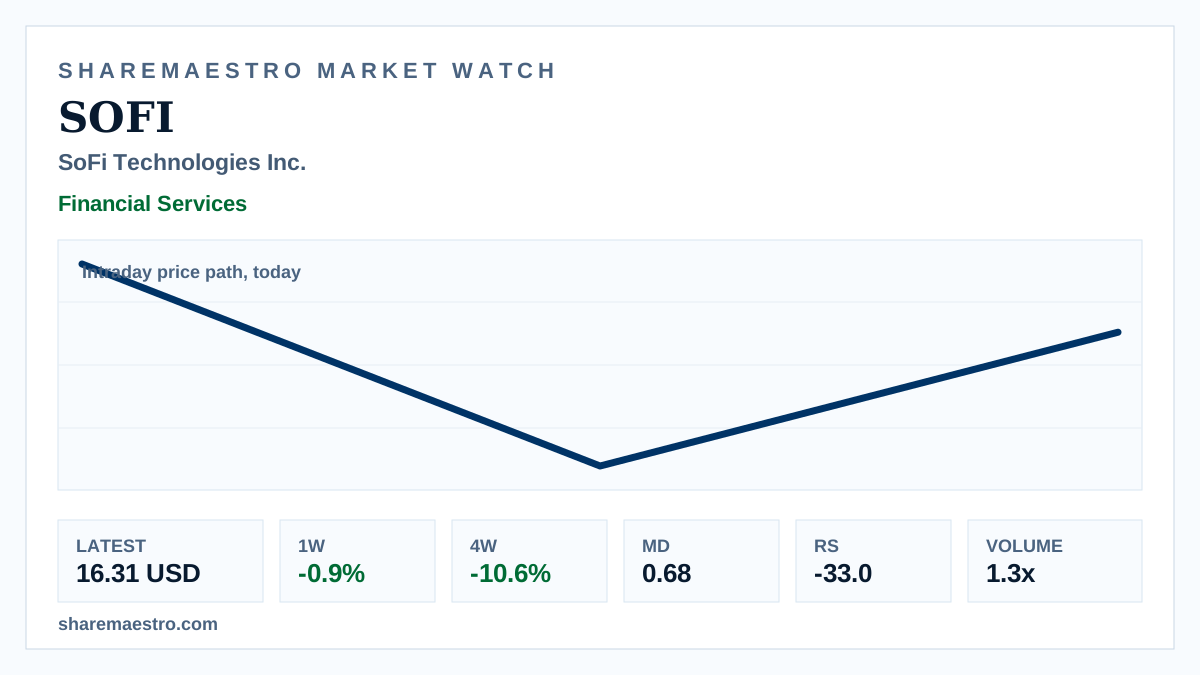
SoFi Technologies Inc. (SOFI) draws heavy activity on 10.5% screen move

The digital-finance stock’s rally is being tested against inactive trend confirmation and negative Relative Strength.

  • The one-week return was -0.9%, the four-week return was -10.6%, and the twelve-week return was 3.6%.
  • Latest weekly volume was 483.4 million shares, or 1.28 times the 13-week average.
  • Market capitalization was about $21.8 billion, placing the move in the large-cap Financial Services group.