Weekly signal · ATI · Industrials

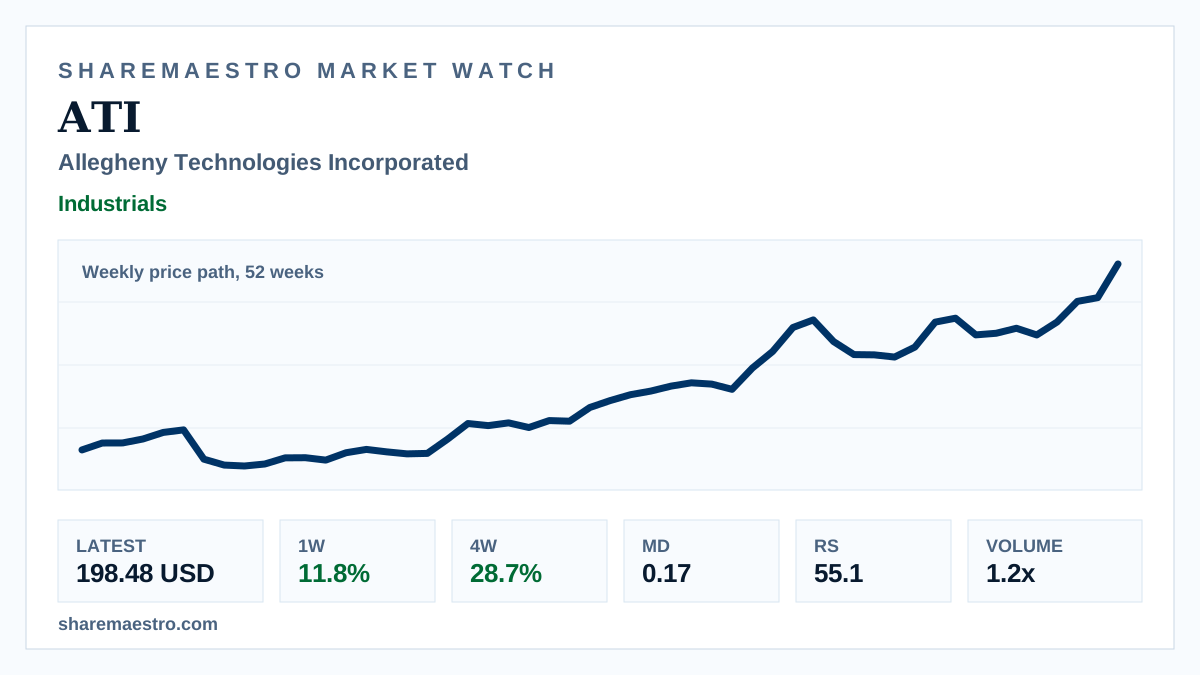
Allegheny Technologies Incorporated (ATI) advances 11.8% as active trend persists

Volume ran above recent levels, and market indicators still lean constructive for the specialty-metals manufacturer.

Latest198.48 USD
1W move11.8%
Volume1.2x
TrendActive
Weekly market chart for Allegheny Technologies with specialty metal fabrication materials in view.
Supporting market chart for Allegheny Technologies Incorporated (ATI) advances 11.8% as active trend persists

Market update

What happened

Allegheny Technologies Incorporated (ATI) closed the latest week at 198.48 USD as gains broadened across the one-, four- and twelve-week windows. The chart shows a weekly price path over 52 weeks, framing the move as multiweek context rather than intraday action.

The confirming evidence is constructive but measured. The trend signal remains active, Market Dynamics shows positive confirmation, and Relative Strength is supportive, while turnover also ran above its recent baseline.

Continue your research

Explore ATI across Sharemaestro

These links are shown because current Sharemaestro data is available for this company.

Evidence context