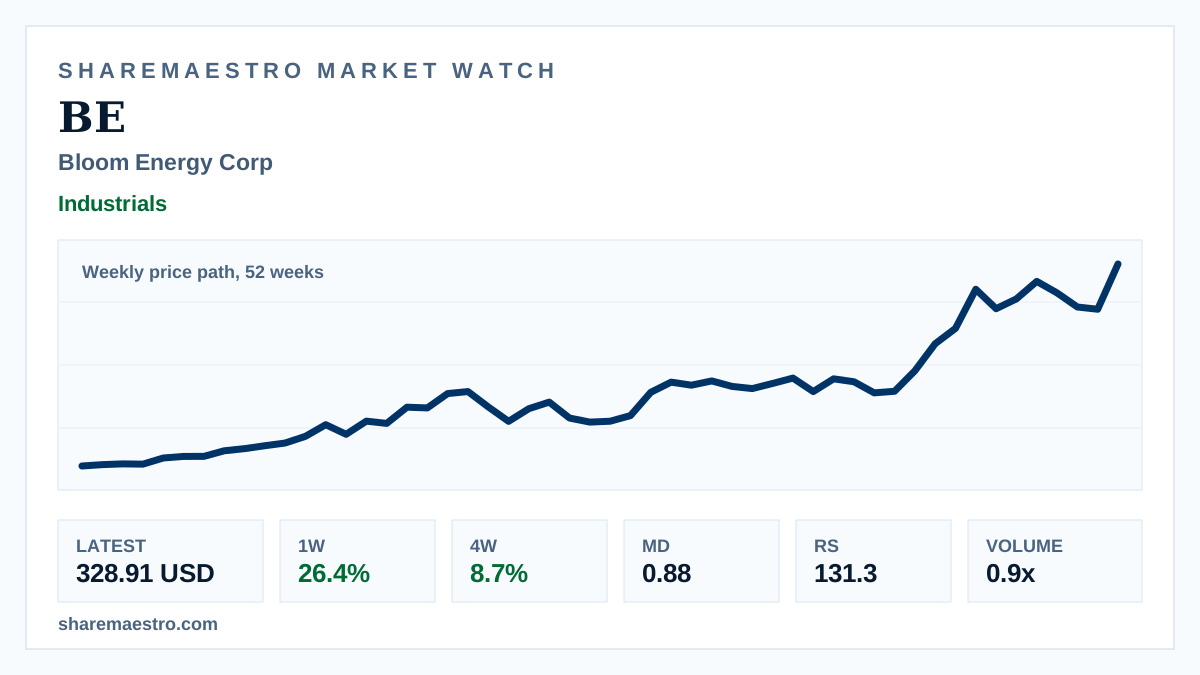
Weekly signal · BE · Industrials

Bloom Energy Corp (BE) jumps 26.4% in latest weekly tape

The fuel-cell systems maker’s weekly setup remains extended, while the live intraday screen adds a check on the move.

Latest328.91 USD
1W move26.4%
Volume0.9x
TrendActive
Bloom Energy weekly market chart beside solid oxide fuel cell power equipment.
Supporting market chart for Bloom Energy Corp (BE) jumps 26.4% in latest weekly tape

Market update

What happened

Bloom Energy Corp (BE) closed the week ended June 19 at 328.91 USD, leaving its four-week advance at 8.7%. The move keeps the San Jose maker of solid oxide fuel cell systems among the stronger industrial electrical-equipment names in the latest weekly market data.

The weekly price path over 52 weeks shows a 146.9% twelve-week advance, and Market Dynamics at 0.88 confirms pressure. The complication is live trading: a separate intraday screen showed 306.57 USD after a 344.05 start, down 10.9% on 48,923 shares.

Continue your research

Explore BE across Sharemaestro

These links are shown because current Sharemaestro data is available for this company.

Evidence context