Earnings watch · FUL · Basic Materials

H B Fuller Company (FUL) gains 9.6% over four weeks before earnings

The specialty-chemicals stock has firm weekly momentum, though relative strength remains a complicating signal before the June 24 report.

Latest63.63 USD
1W move6.3%
Volume0.9x
TrendActive
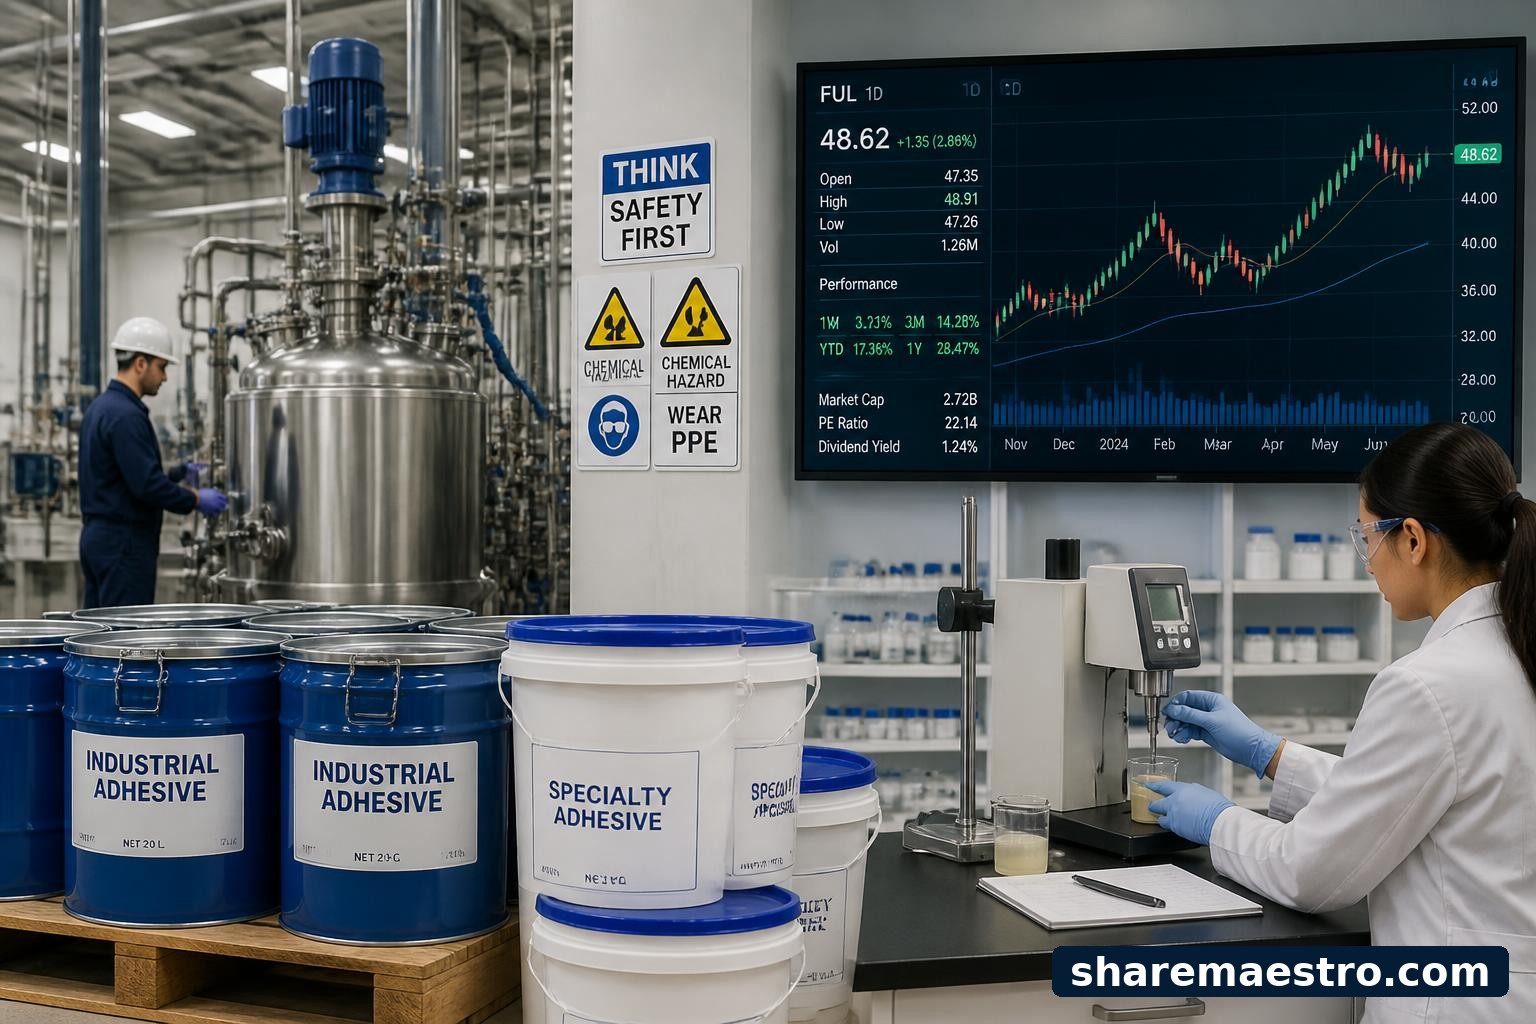
Adhesive and specialty-chemical production equipment with a market-data screen for H B Fuller Company.
Supporting market chart for H B Fuller Company (FUL) gains 9.6% over four weeks before earnings

Market update

What happened

H B Fuller Company (FUL) closed at 63.63 USD in the latest weekly market data, adding 6.3% over one week and extending its twelve-week gain to 29.6%. The 52-week weekly price path shows the stock entering earnings with a stronger recent tone rather than a live intraday move.

Confirmation is mixed. The trend signal is active and Market Dynamics shows modest positive pressure, but Relative Strength sits at -3.8 and the latest volume was 0.95 times the 13-week average. The company is scheduled to report on June 24 for the fiscal period ended May 31, with the earnings estimate at 1.37 USD.

Continue your research

Explore FUL across Sharemaestro

These links are shown because current Sharemaestro data is available for this company.

Evidence context