Weekly signal · NEM · Basic Materials

Newmont Goldcorp Corp (NEM) rally runs ahead of trend confirmation

The gold miner’s near-term returns have strengthened, but Market Dynamics still shows pressure and the trend signal remains inactive.

Latest112.98 USD
1W move20.6%
Volume1.0x
TrendInactive
Weekly market chart context for Newmont Goldcorp Corp shares and gold-mining operations.
Supporting market chart for Newmont Goldcorp Corp (NEM) rally runs ahead of trend confirmation

Market update

What happened

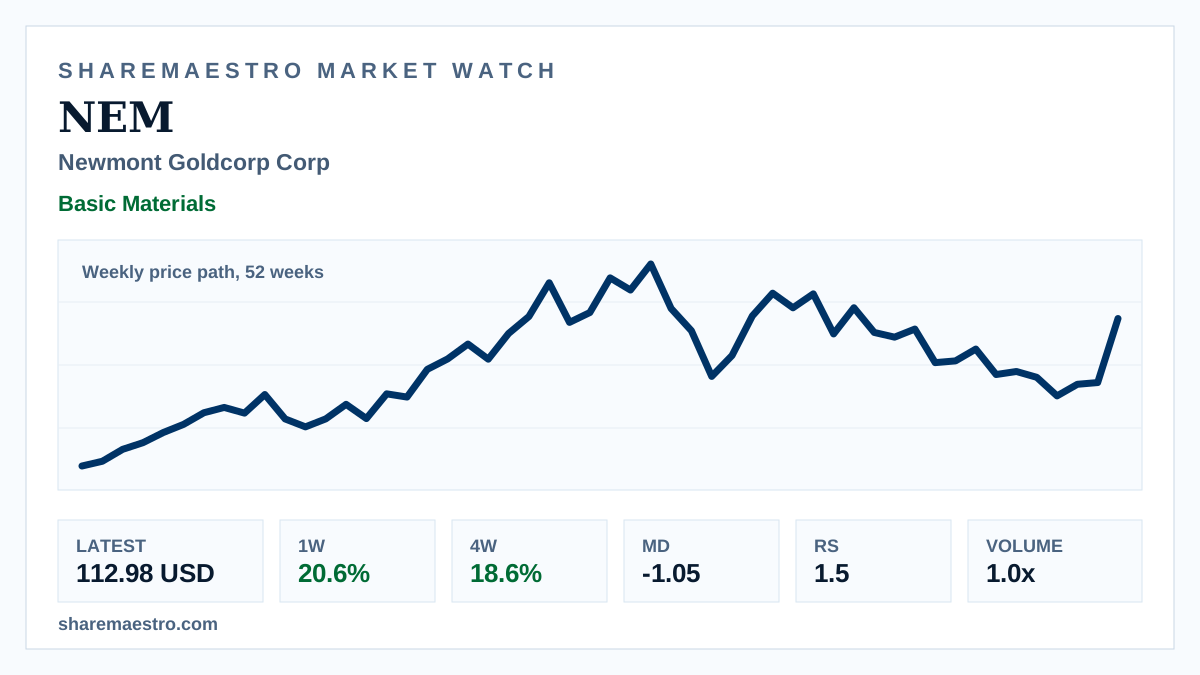
Newmont Goldcorp Corp (NEM) closed the latest week at $112.98, gaining 20.6% for the week and 18.6% over four weeks.

Confirmation remains uneven: Relative Strength is 1.5, while Market Dynamics shows weakness at -1.05 and the trend signal is inactive. Weekly turnover was 38.7 million shares, about 1.2x the active-mover screen measure.

The chart shows a weekly price path over 52 weeks, placing the move in weekly context rather than live intraday action. A separate intraday screen last showed the stock at $116.10, up 2.2% from its start price, on 75,298 shares.

Continue your research

Explore NEM across Sharemaestro

These links are shown because current Sharemaestro data is available for this company.

Evidence context