Weekly signal · OKLO · Utilities

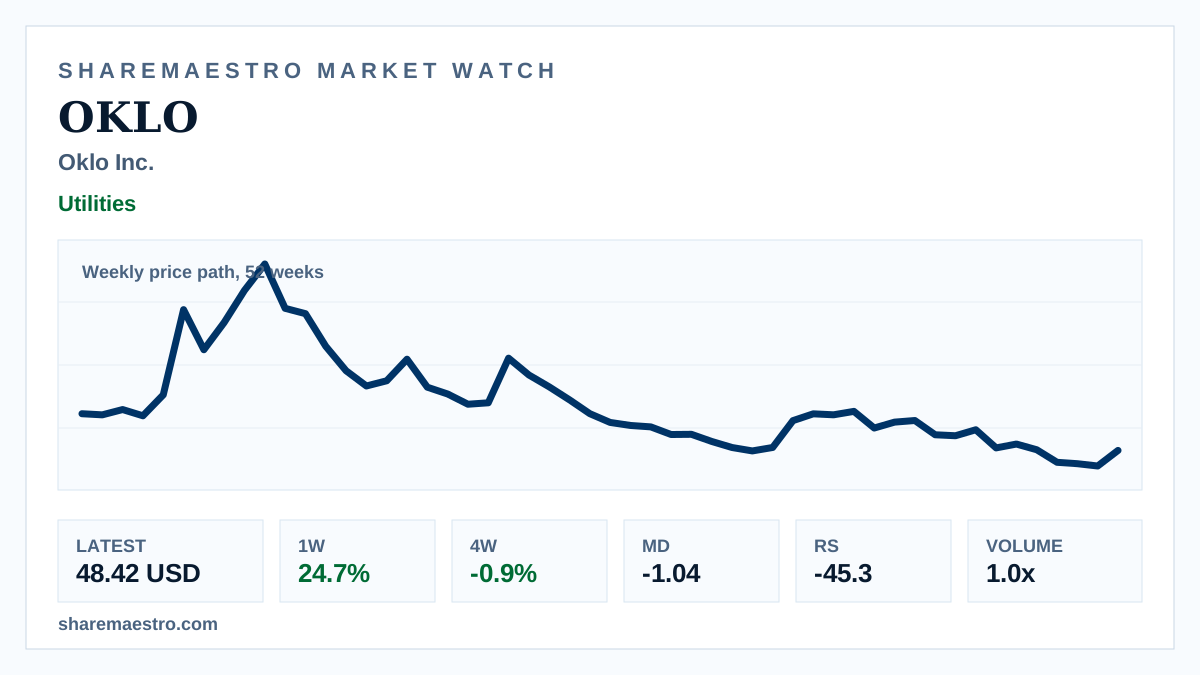
Oklo Inc. (OKLO) 24.7% weekly rally clashes with negative medium-term returns

The fission-power developer regained ground in weekly context, but trend, Relative Strength and pressure readings have not confirmed the move.

Latest48.42 USD
1W move24.7%
Volume1.0x
TrendInactive
Weekly market chart context for Oklo Inc. alongside advanced fission power plant control-room imagery.
Supporting market chart for Oklo Inc. (OKLO) 24.7% weekly rally clashes with negative medium-term returns

Market update

What happened

Oklo Inc. (OKLO) finished the week ended Aug. 7 at $48.42, staging a sharp rebound on the weekly price path over 52 weeks.

The setup remains mixed. The four-week return is -0.9% and the twelve-week return is -22.2%, while the trend signal is inactive, Relative Strength is -45.3 and Market Dynamics point to pressure rather than confirmation.

Continue your research

Explore OKLO across Sharemaestro

These links are shown because current Sharemaestro data is available for this company.

Evidence context