Weekly signal · SITM · Technology

SiTime Corporation (SITM) regains weekly momentum after recent pullback

The silicon timing specialist’s latest weekly move contrasts with a still-negative four-week reading, leaving the setup firm but not clean.

Latest729.89 USD
1W move16.7%
Volume0.9x
TrendActive
Semiconductor timing chip beside a financial terminal showing a weekly market chart.
Supporting market chart for SiTime Corporation (SITM) regains weekly momentum after recent pullback

Market update

What happened

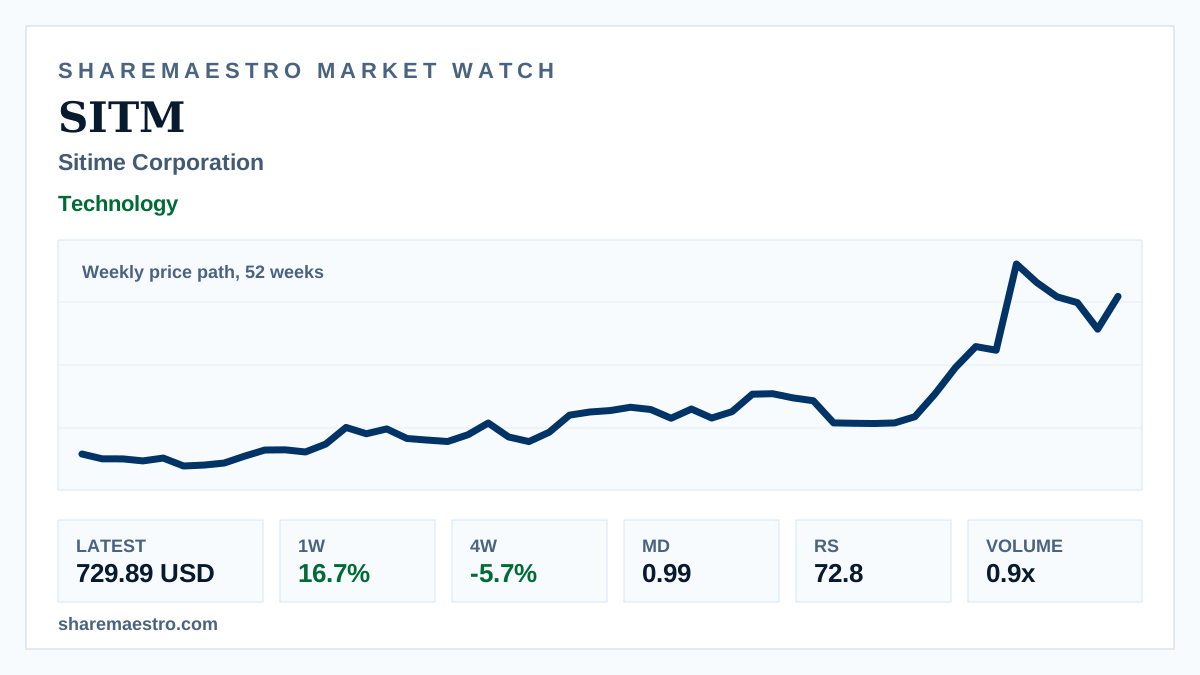
SiTime Corporation (SITM) closed at 729.89 USD in the latest weekly market data, up 16.7% for the week. The chart shows a weekly price path over 52 weeks, so the move is best read as weekly context rather than live intraday action.

The confirming evidence is an active trend state with Market Dynamics showing pressure at 0.99. The complication is that the stock has not fully repaired its recent pullback, keeping the broader signal mixed despite strong longer-term performance.

Continue your research

Explore SITM across Sharemaestro

These links are shown because current Sharemaestro data is available for this company.

Evidence context