Volume surge · TMO · Healthcare

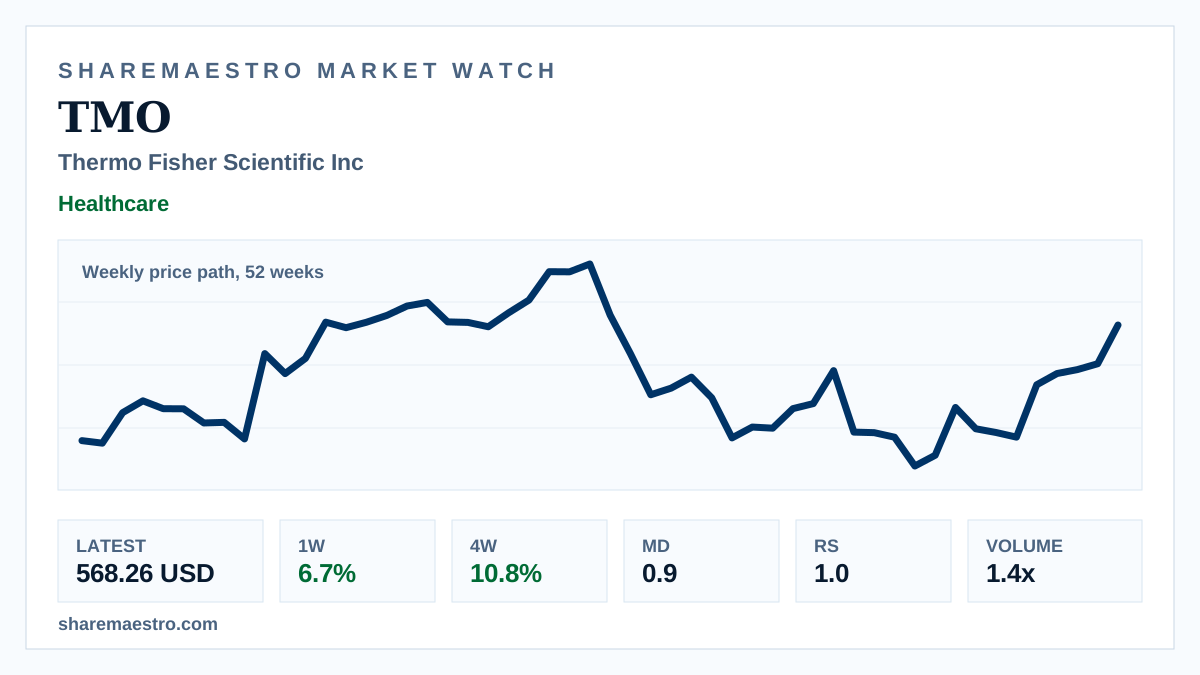
Thermo Fisher Scientific Inc (TMO) extends 12-week climb as turnover builds

The diagnostics and research group’s weekly context shows a sustained rebound, though the trend screen has not yet moved to active.

Latest568.26 USD
1W move6.7%
Volume1.4x
TrendInactive
Weekly market chart context for Thermo Fisher Scientific shares.
Supporting market chart for Thermo Fisher Scientific Inc (TMO) extends 12-week climb as turnover builds

Market update

What happened

Thermo Fisher Scientific Inc (TMO) closed at 568.26 USD for the week ended July 24, lifting its one-week return to 6.7% and its twelve-week return to 21.2%. The 52-week weekly price path points to a stronger medium-term recovery rather than live intraday action.

Confirmation came from heavier trading, with latest weekly volume at 16.2 million shares versus a 13-week average of 11.3 million. Market Dynamics showed positive confirmation at 0.9 and Relative Strength stood at 1.0, while the trend signal remained inactive, leaving the evidence constructive but not uniform.

Continue your research

Explore TMO across Sharemaestro

These links are shown because current Sharemaestro data is available for this company.

Evidence context