Weekly signal · WWD · Industrials

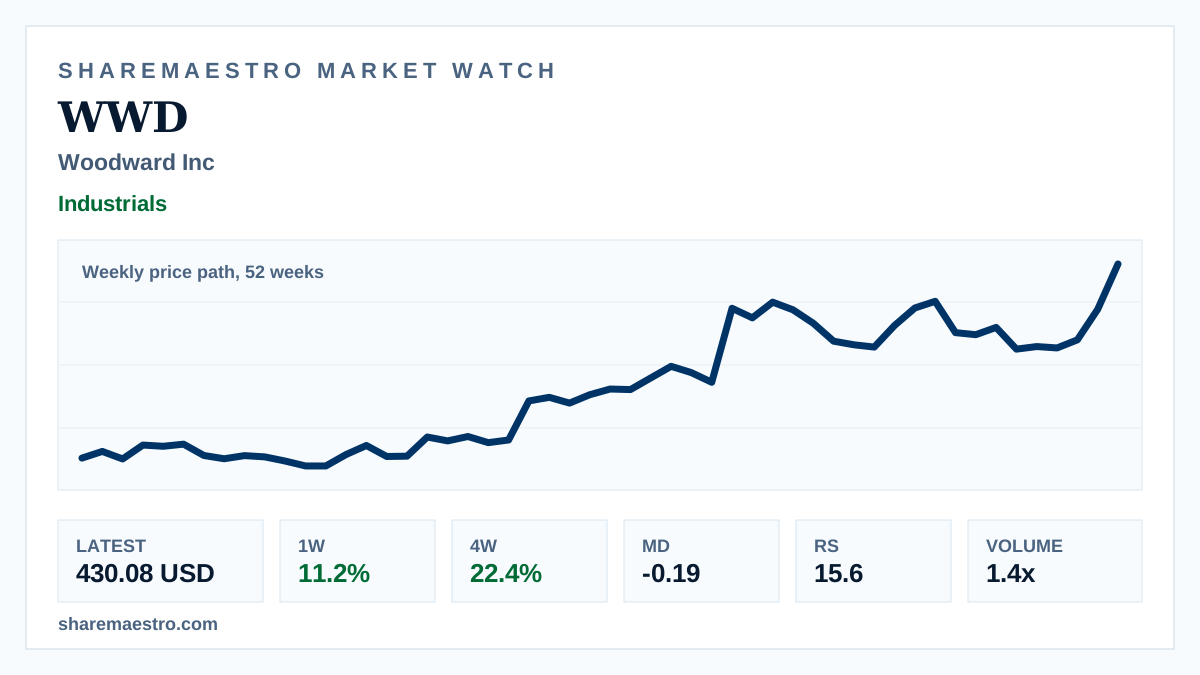
Woodward Inc (WWD) breaks higher with an 11.2% weekly climb

The aerospace and industrial-controls maker’s one-month return is nearly equal to its twelve-week gain, pointing to a recent acceleration in the shares.

Latest430.08 USD
1W move11.2%
Volume1.4x
TrendActive
Finance terminal and precision aerospace control components representing Woodward’s weekly market move.
Supporting market chart for Woodward Inc (WWD) breaks higher with an 11.2% weekly climb

Market update

What happened

Woodward Inc (WWD) rose 11.2% in the week ended June 19, extending a sharp move in the Industrials group. The stock’s latest weekly action came with heavier trading than its recent norm.

The chart shows a weekly price path over 52 weeks, not live intraday action. The trend signal is active and Relative Strength is firm, but Market Dynamics remains under pressure, leaving the technical evidence positive but not uniform.

Continue your research

Explore WWD across Sharemaestro

These links are shown because current Sharemaestro data is available for this company.

Evidence context