Weekly signal · ACN · Technology

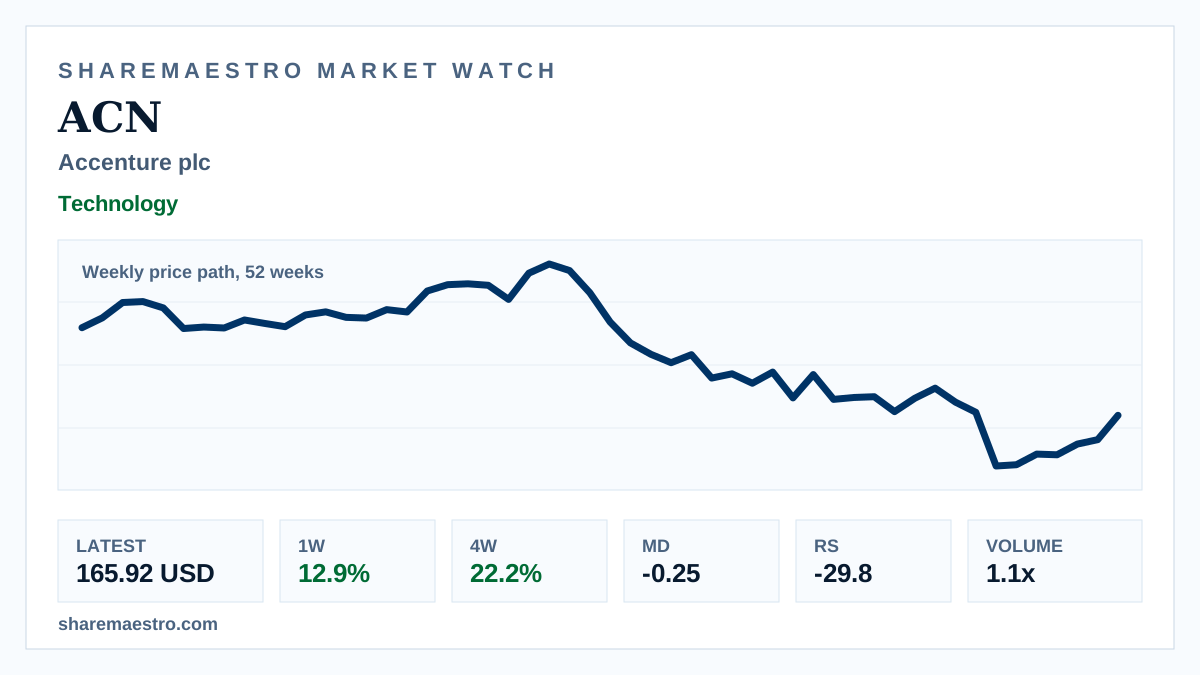
Accenture plc (ACN) four-week rebound reaches 22.2% despite weak 12-week tape

The IT-services stock has recovered sharply in weekly context, but trend confirmation remains limited and Relative Strength is still negative.

Latest165.92 USD
1W move12.9%
Volume1.1x
TrendInactive
Weekly Accenture stock chart with volume bars and IT-services market context.
Supporting market chart for Accenture plc (ACN) four-week rebound reaches 22.2% despite weak 12-week tape

Market update

What happened

Accenture plc (ACN) closed the latest week at 165.92 USD, rising 12.9% for the week and extending its four-week gain to 22.2%. The 52-week weekly price path shows a strong recent rebound rather than live intraday action.

The setup is still mixed. The stock remains down -8.0% over 12 weeks, the trend signal is inactive, and Market Dynamics show mild pressure at -0.25. Relative Strength is also negative at -29.8, while weekly volume of 47.3 million shares ran above the 13-week average of 41.6 million.

Continue your research

Explore ACN across Sharemaestro

These links are shown because current Sharemaestro data is available for this company.

Evidence context