Weekly signal · AXSM · Healthcare

Axsome Therapeutics Inc (AXSM) finishes week 9.8% higher in active trend

The CNS-therapy developer’s twelve-week return is now 62.6%, putting the move in a broader biotech rebound rather than a single-week move.

Latest255.17 USD
1W move9.8%
Volume1.0x
TrendActive
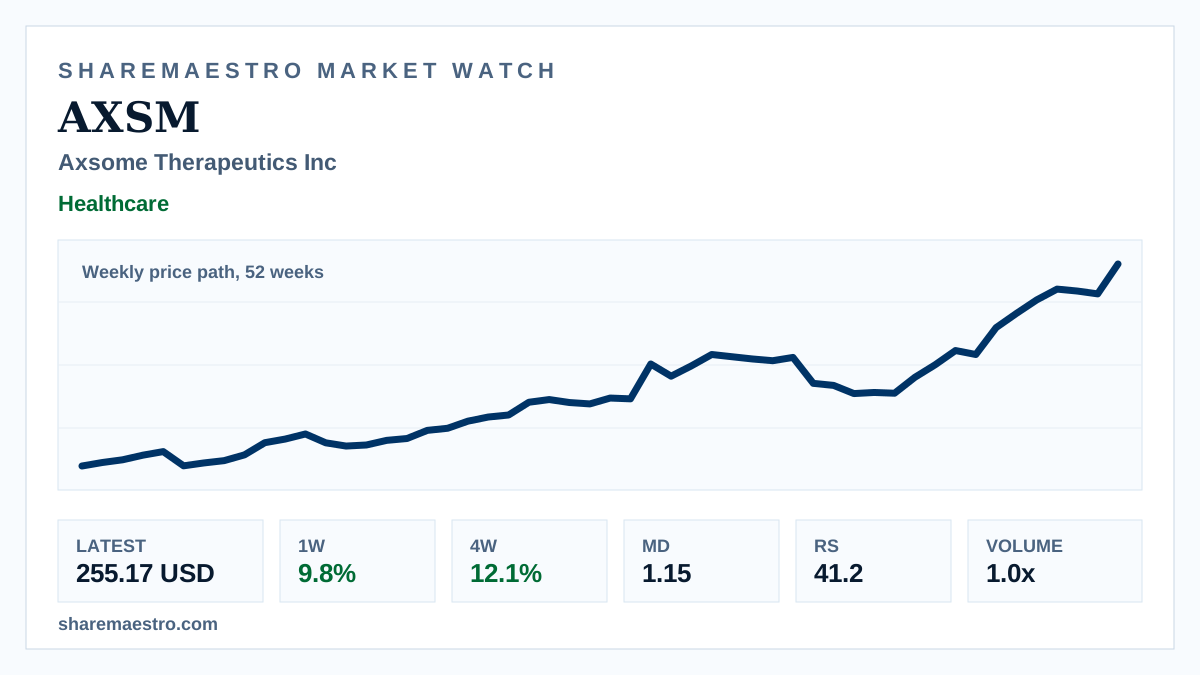
Weekly chart for Axsome Therapeutics showing share price and volume over 52 weeks.
Supporting market chart for Axsome Therapeutics Inc (AXSM) finishes week 9.8% higher in active trend

Market update

What happened

Axsome Therapeutics Inc (AXSM) closed the latest week at $255.17, extending its four-week advance to 12.1% as of June 12. The Healthcare stock remains a large-cap biotechnology mover with a market value of about $12.0 billion.

In the weekly price path over 52 weeks, the trend signal is active and volume was near normal at 3.44 million shares, or 0.99x the 13-week average. Market Dynamics at 1.15 adds confirmation, but Relative Strength at 41.2 leaves the evidence mixed rather than uniformly strong.

Continue your research

Explore AXSM across Sharemaestro

These links are shown because current Sharemaestro data is available for this company.

Evidence context