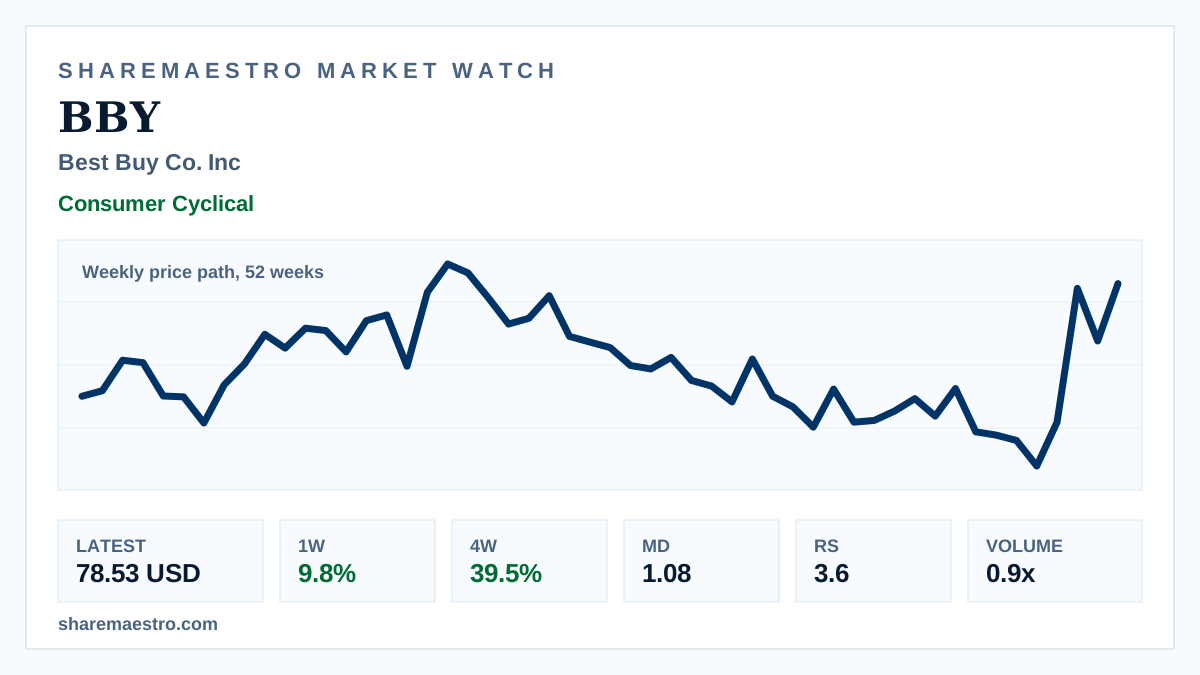
Weekly signal · BBY · Consumer Cyclical

Best Buy Co. Inc (BBY) rebound faces mixed weekly confirmation

The electronics retailer’s 39.5% four-week advance is substantial, but inactive trend status and lighter participation keep the setup uneven.

Latest78.53 USD
1W move9.8%
Volume0.9x
TrendInactive
Best Buy electronics retail display with a generic weekly market chart screen.
Supporting market chart for Best Buy Co. Inc (BBY) rebound faces mixed weekly confirmation

Market update

What happened

Best Buy Co. Inc (BBY) ended the week of June 12 at 78.53 USD, rising 9.8% for the week. The chart is a weekly price path over 52 weeks, so the move reads as medium-term context rather than live intraday action.

Confirmation is not uniform. Market Dynamics improved to 1.08 and the 12-week return stands at 27.0%, while Relative Strength of 3.6, an inactive trend signal and below-average volume temper the advance.

Continue your research

Explore BBY across Sharemaestro

These links are shown because current Sharemaestro data is available for this company.

Evidence context