Weekly signal · OWL · Financial Services

Blue Owl Capital Inc (OWL) rebound runs into inactive trend signal

The asset manager’s short-term gains improved, but relative strength and trend confirmation remain mixed.

Latest10.30 USD
1W move9.0%
Volume1.1x
TrendInactive
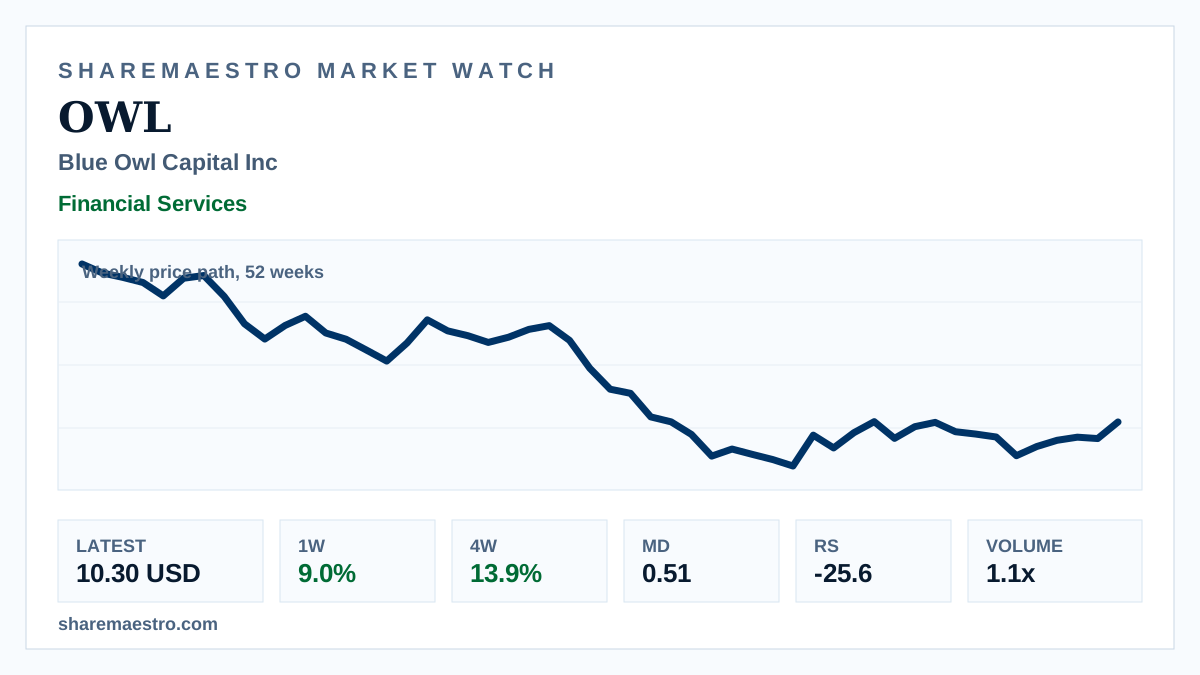
Weekly market chart for Blue Owl Capital in an asset-management desk setting.
Supporting market chart for Blue Owl Capital Inc (OWL) rebound runs into inactive trend signal

Market update

What happened

Blue Owl Capital Inc (OWL) closed the latest week at 10.30 USD, rising 9.0% and extending its four-week move to 13.9% in weekly market data.

The weekly context over 52 weeks is not one-sided. Market Dynamics at 0.51 provided moderate confirmation, while the trend signal stayed inactive and Relative Strength remained weak at -25.6. Volume evidence was also mixed, with active-mover activity at 1.7x even as reported weekly volume sat only slightly above its 13-week average.

Continue your research

Explore OWL across Sharemaestro

These links are shown because current Sharemaestro data is available for this company.

Evidence context