Weekly signal · CRDO · Technology

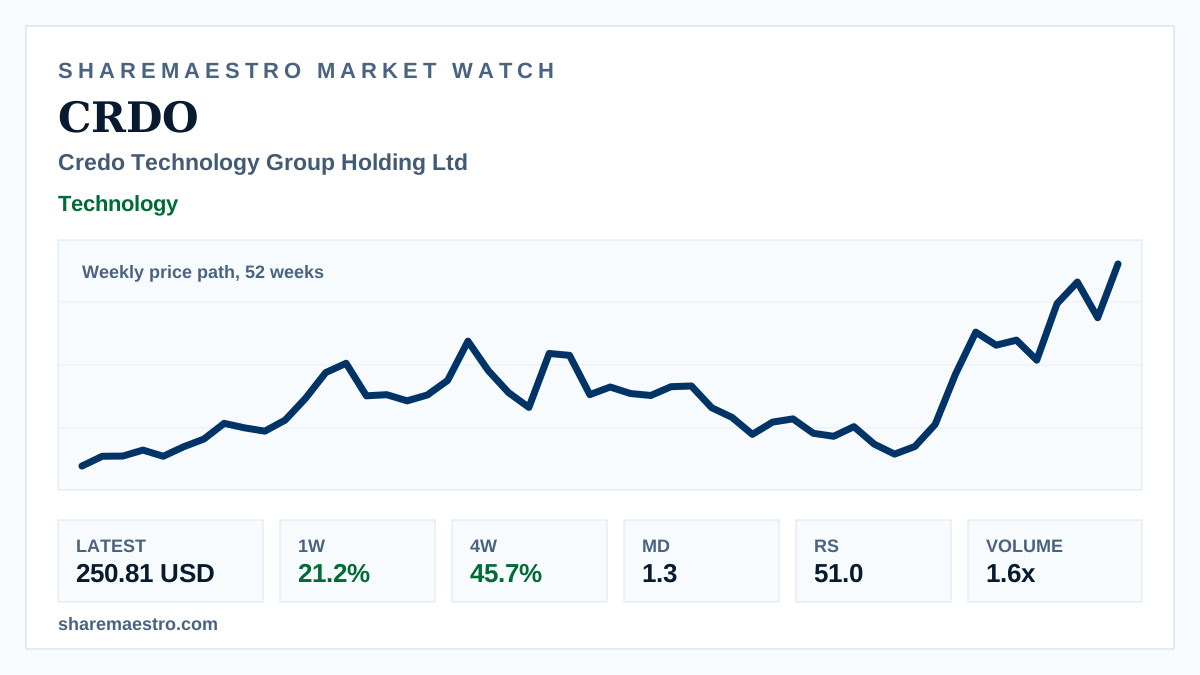
Credo Technology’s 45.7% four-week climb puts weekly close at $250.81

CRDO’s weekly context shows strong momentum across one-, four- and 12-week windows, with Market Dynamics providing confirmation.

Latest250.81 USD
1W move+21.2%
Volume1.6x
TrendActive
Weekly market chart and trading desk screens for Credo Technology stock.
Supporting market chart for Credo Technology’s 45.7% four-week climb puts weekly close at $250.81

Market update

What happened

Credo Technology Group closed the week of June 12 at $250.81, up 21.2% over one week and 45.7% over four weeks.

The semiconductor connectivity stock has gained 142.6% over 12 weeks, with its trend signal active and relative strength at 51.0.

Market Dynamics stood at 1.3, offering confirmation rather than a cooling read. Volume measures were mixed, with latest weekly volume at 60.5 million versus a 37.9 million 13-week average, while the local setup volume ratio was near 1.0x.

Continue your research

Explore CRDO across Sharemaestro

These links are shown because current Sharemaestro data is available for this company.

Evidence context