Weekly signal · CRDO · Technology

Credo Technology Group Holding Ltd (CRDO) extends weekly semiconductor run with 142.6% twelve-week gain

The move keeps the high-speed connectivity stock in an active trend as volume and confirmation indicators point to sustained attention.

Latest250.81 USD
1W move21.2%
Volume1.6x
TrendActive
Weekly market chart context for Credo Technology Group Holding Ltd in the semiconductor sector.
Supporting market chart for Credo Technology Group Holding Ltd (CRDO) extends weekly semiconductor run with 142.6% twelve-week gain

Market update

What happened

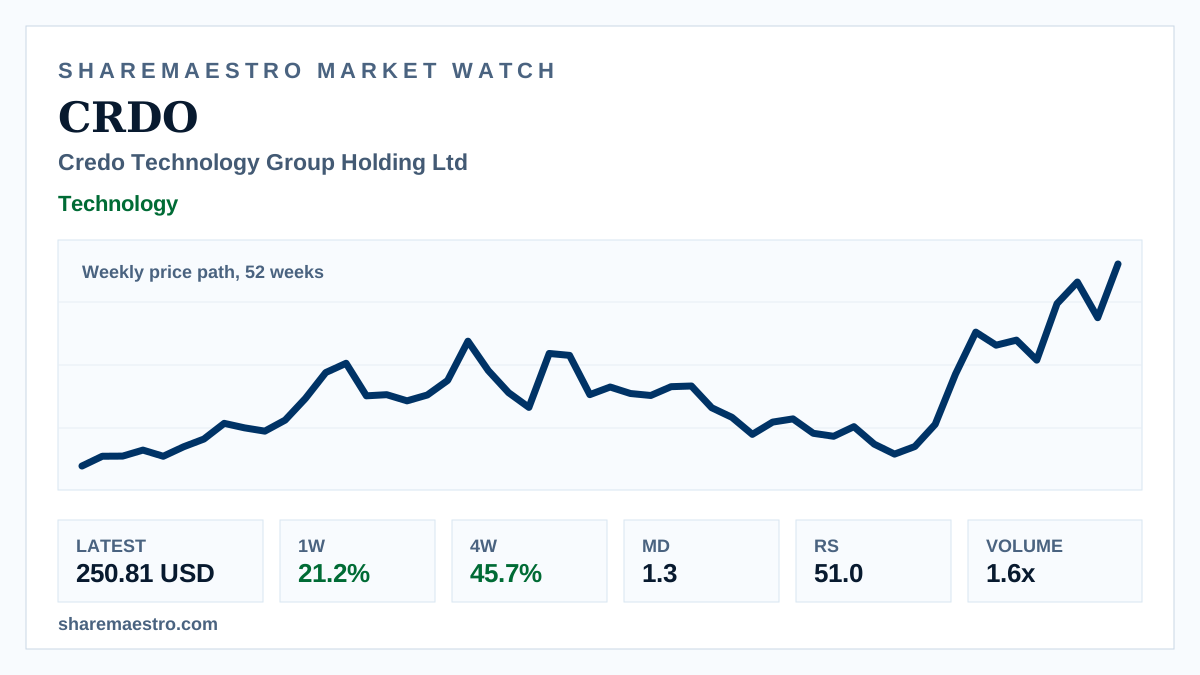
Credo Technology Group Holding Ltd (CRDO) closed at 250.81 USD in the latest weekly reading, adding 21.2% for the week and 45.7% over four weeks. The chart shows the weekly price path over 52 weeks, putting the latest move in broader context rather than intraday trading.

Supporting evidence is constructive but not uniform. Weekly volume reached 60.5 million shares, about 1.6x the 13-week average, while the trend signal remained active and Market Dynamics at 1.3 showed confirmation. Relative Strength was 51.0, a more moderate reading than the stock’s price momentum alone would suggest.

Continue your research

Explore CRDO across Sharemaestro

These links are shown because current Sharemaestro data is available for this company.

Evidence context