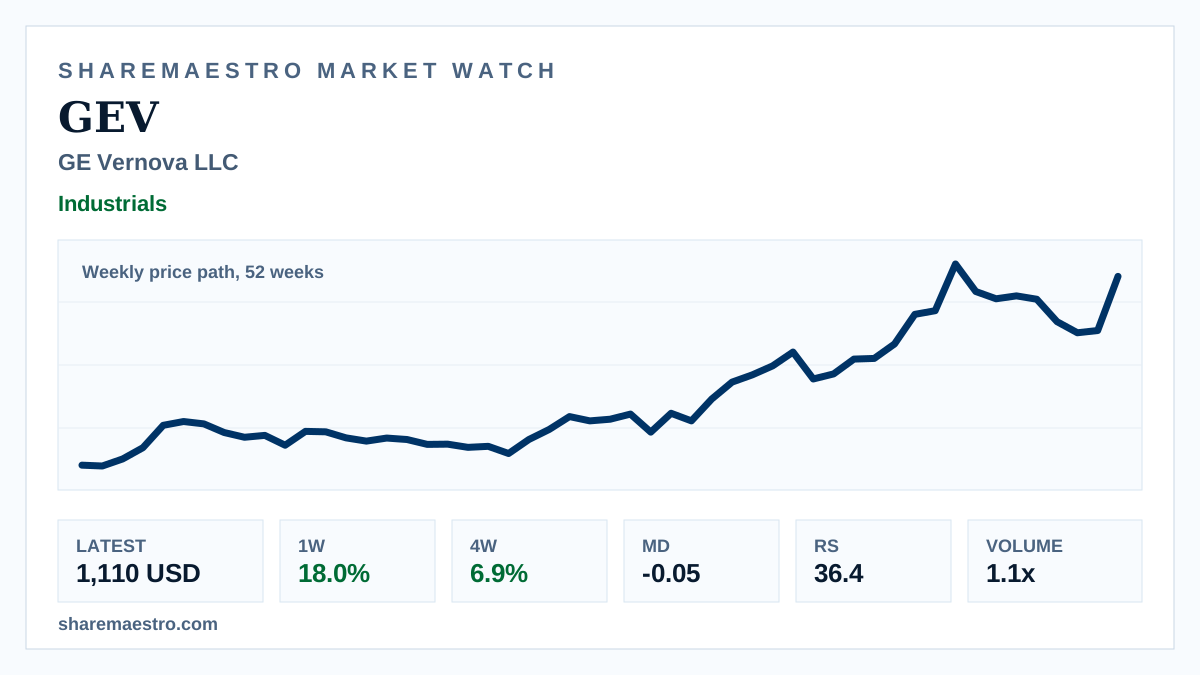
Weekly signal · GEV · Industrials

GE Vernova LLC (GEV) keeps active trend as weekly move broadens

The Industrials stock logged a strong weekly gain, while Relative Strength and Market Dynamics leave confirmation mixed.

Latest1,110 USD
1W move18.0%
Volume1.1x
TrendActive
Weekly market chart for GE Vernova with power-generation and grid equipment.
Supporting market chart for GE Vernova LLC (GEV) keeps active trend as weekly move broadens

Market update

What happened

GE Vernova LLC (GEV) finished the latest week at 1,110 USD, up 18.0% for the week in the 52-week weekly price path through June 19.

The move had participation, with weekly volume of 14.5 million shares versus a 13-week average of 12.7 million. The trend signal remains active, but Relative Strength at 36.4 and Market Dynamics at -0.05 point to mild pressure beneath the advance.

Continue your research

Explore GEV across Sharemaestro

These links are shown because current Sharemaestro data is available for this company.

Evidence context