Weekly signal ยท INTC ยท Technology

Intel Corporation (INTC) weekly slide stretches across the chip tape

The semiconductor heavyweight remains in an active trend, but confirmation readings and volume leave the setup mixed.

Latest95.04 USD
1W move-13.5%
Volume0.9x
TrendActive
Weekly market context for Intel Corporation shares with semiconductor wafers and stock-chart visuals.
Supporting market chart for Intel Corporation (INTC) weekly slide stretches across the chip tape

Market update

What happened

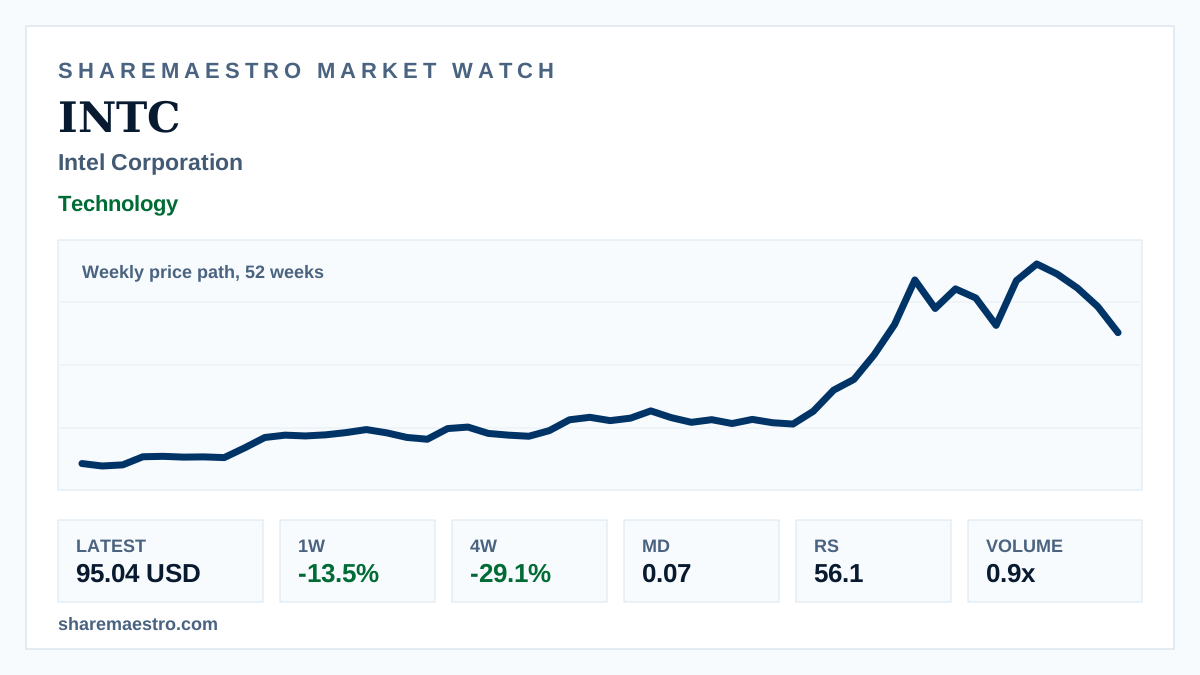
Intel Corporation (INTC) closed the latest week at 95.04 USD with a one-week return of -13.5%. The chart is a weekly price path over 52 weeks, framing the move as medium-term pressure rather than live intraday action.

The four-week return is -29.1%, although the twelve-week return remains 15.1%. Market Dynamics at 0.07 shows weak confirmation, while Relative Strength is 56.1 and weekly volume sat below its 13-week average.

Continue your research

Explore INTC across Sharemaestro

These links are shown because current Sharemaestro data is available for this company.

Evidence context