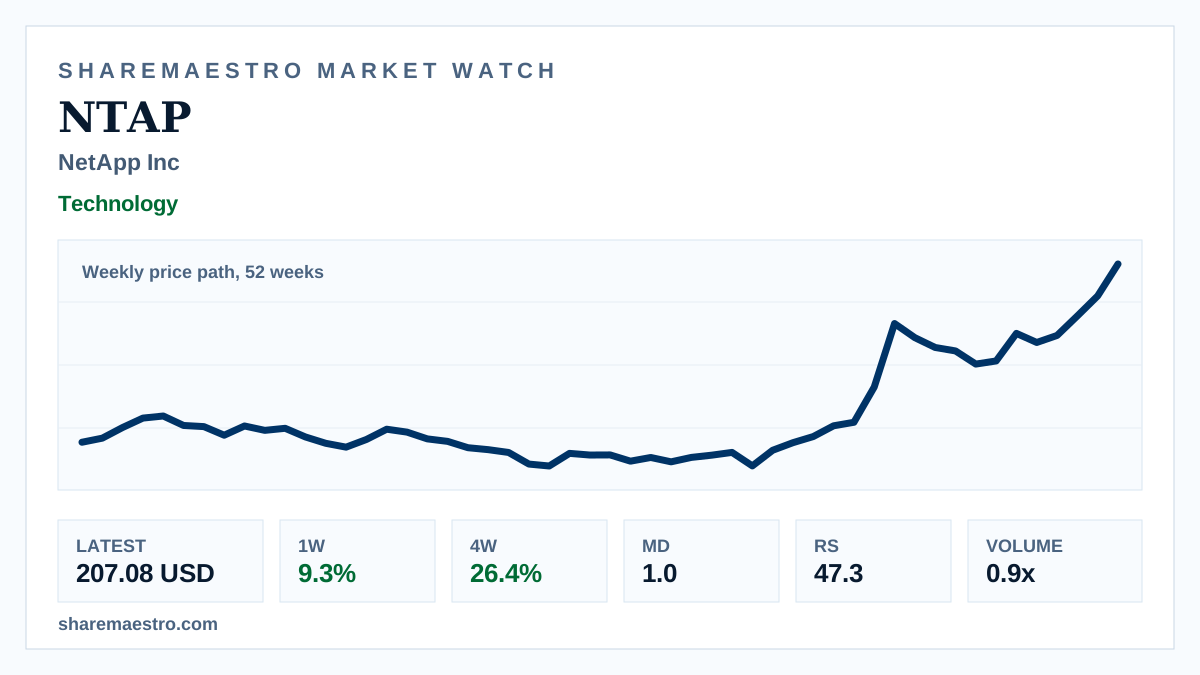
Weekly signal · NTAP · Technology

NetApp Inc (NTAP) holds above $200 with weekly trend still active

The infrastructure software stock’s 52-week weekly context shows strong follow-through, though participation and relative-strength readings are less decisive.

Latest207.08 USD
1W move9.3%
Volume0.9x
TrendActive
Weekly market chart context for NetApp with cloud data infrastructure imagery.
Supporting market chart for NetApp Inc (NTAP) holds above $200 with weekly trend still active

Market update

What happened

NetApp Inc (NTAP) ended the latest week at 207.08 USD, rising 9.3% for the week ended Aug. 14, 2026. The move kept the Nasdaq-listed technology stock above the $200 mark in weekly market data.

The setup is positive but mixed. The weekly price path over 52 weeks remains in an active trend with Market Dynamics confirmation, while turnover and Relative Strength do not show the same degree of force.

Continue your research

Explore NTAP across Sharemaestro

These links are shown because current Sharemaestro data is available for this company.

Evidence context