Weekly signal ยท OKTA ยท Technology

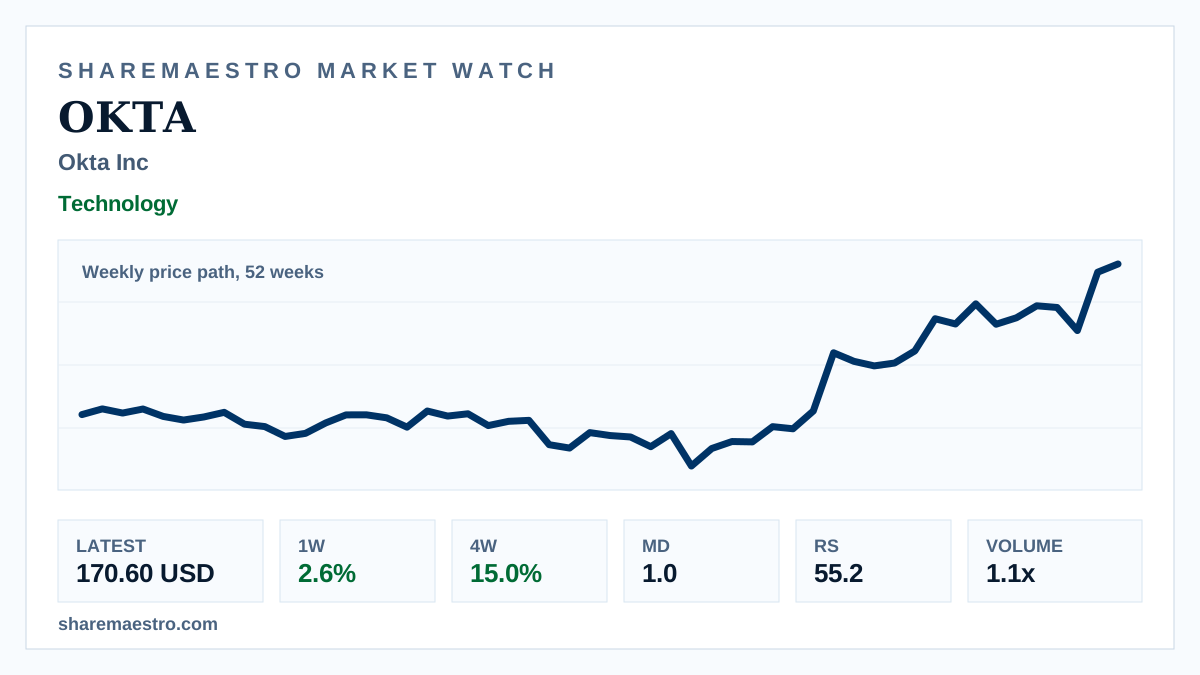
Okta Inc (OKTA) weekly chart carries a 46.7% 12-week advance

The identity-management software stockโ€™s longer run remains the main story, with the latest close holding well above recent weekly levels.

Latest170.60 USD
1W move2.6%
Volume1.1x
TrendActive
Okta weekly market chart with volume bars and identity-security software visuals.
Supporting market chart for Okta Inc (OKTA) weekly chart carries a 46.7% 12-week advance

Market update

What happened

Okta Inc (OKTA) closed the latest week at 170.60 USD, adding 2.6% in the weekly price path over 52 weeks. The move kept the Technology stock in an active trend state as the broader 12-week advance reached 46.7%.

The confirming evidence is positive but measured. Four-week return stands at 15.0%, Market Dynamics provided confirmation, and Relative Strength was 55.2. Weekly volume was 18.4 million shares, above the 13-week average of 16.2 million.

Continue your research

Explore OKTA across Sharemaestro

These links are shown because current Sharemaestro data is available for this company.

Evidence context