Weekly signal ยท RVMD ยท Healthcare

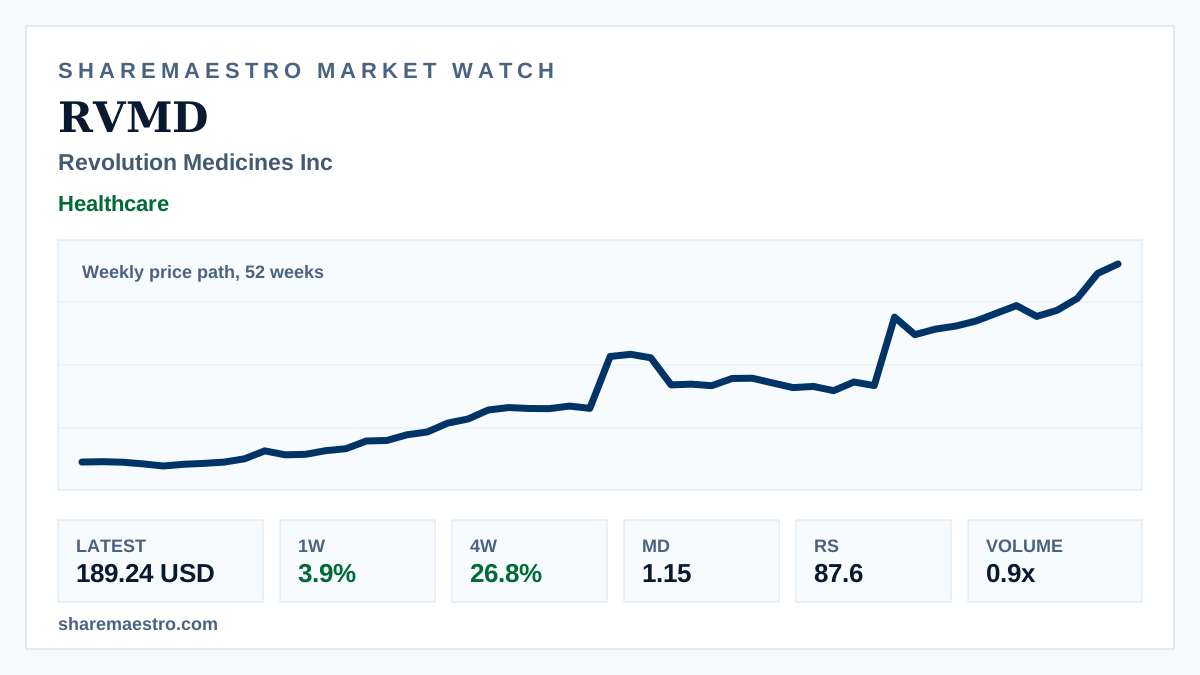
Revolution Medicines Inc (RVMD) extends 12-week biotech surge to 96.2%

The oncology developerโ€™s weekly setup remains firm, with trend and relative-strength readings supportive while volume confirmation is below average.

Latest189.24 USD
1W move3.9%
Volume0.9x
TrendActive
Weekly market chart concept for Revolution Medicines with biotechnology research imagery.
Supporting market chart for Revolution Medicines Inc (RVMD) extends 12-week biotech surge to 96.2%

Market update

What happened

Revolution Medicines Inc (RVMD) closed the latest week at 189.24 USD, rising 3.9% and extending its four-week gain to 26.8%. The chart is a weekly price path over 52 weeks, framing the move as a sustained medium-term advance rather than live intraday action.

Confirmation is constructive but not clean. The trend signal is active, Relative Strength is high at 87.6, and Market Dynamics show positive pressure at 1.15, while volume ran below normal at about 0.6x on the weekly setup screen.

Continue your research

Explore RVMD across Sharemaestro

These links are shown because current Sharemaestro data is available for this company.

Evidence context