Volume surge · SONY · Technology

Sony Group Corp (SONY) rebound gains force on weekly screen

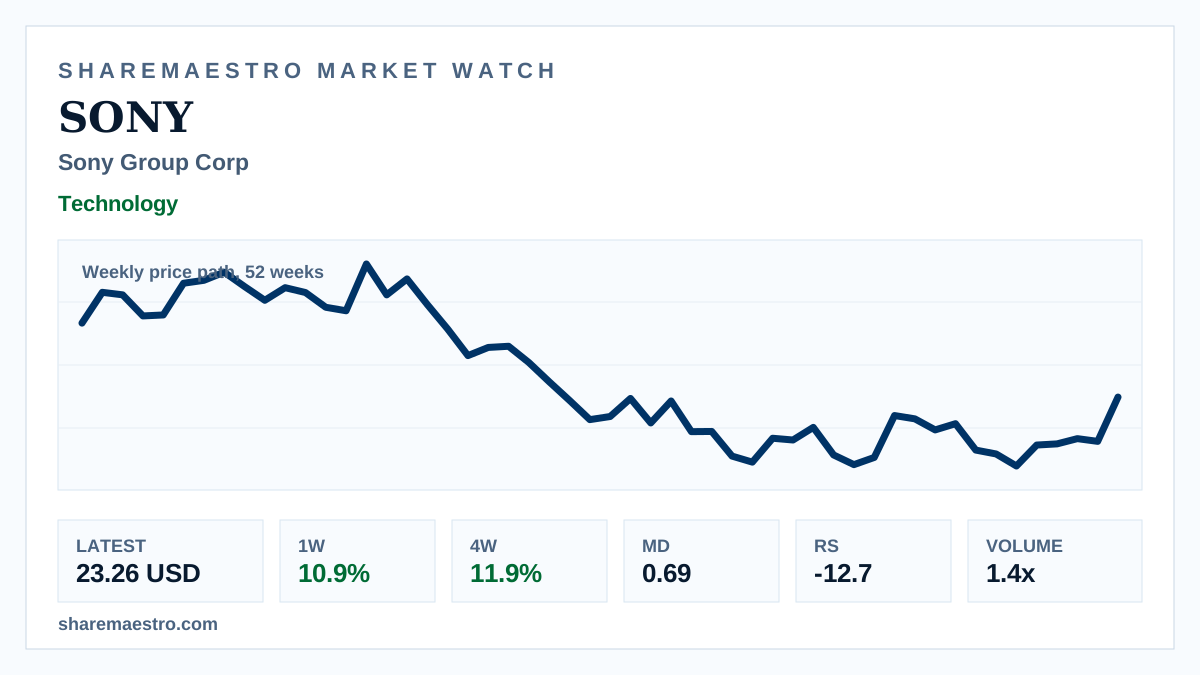
The 52-week weekly price path points to a stronger July finish, while participation and momentum readings keep the picture measured.

Latest23.26 USD
1W move10.9%
Volume1.4x
TrendInactive
Weekly market chart and consumer-electronics desk setup representing Sony Group shares.
Supporting market chart for Sony Group Corp (SONY) rebound gains force on weekly screen

Market update

What happened

Sony Group Corp (SONY) closed at 23.26 USD in the latest weekly market data, up 10.9% for the week. The move put the NYSE-listed consumer-electronics group on the active-mover screen.

Confirmation was mixed rather than clean. Market Dynamics showed positive confirmation at 0.69, but the trend signal remained inactive and Relative Strength was still negative at -12.7.

Continue your research

Explore SONY across Sharemaestro

These links are shown because current Sharemaestro data is available for this company.

Evidence context