Weekly signal · VEEV · Healthcare

Veeva Systems Inc Class A (VEEV) keeps its weekly trend active after a 52.2% 12-week run

The life-sciences software stock’s advance is broad, but lighter turnover and negative relative strength leave the confirmation mixed.

Latest243.75 USD
1W move5.8%
Volume0.8x
TrendActive
Healthcare software market data screen with weekly chart context for Veeva Systems.
Supporting market chart for Veeva Systems Inc Class A (VEEV) keeps its weekly trend active after a 52.2% 12-week run

Market update

What happened

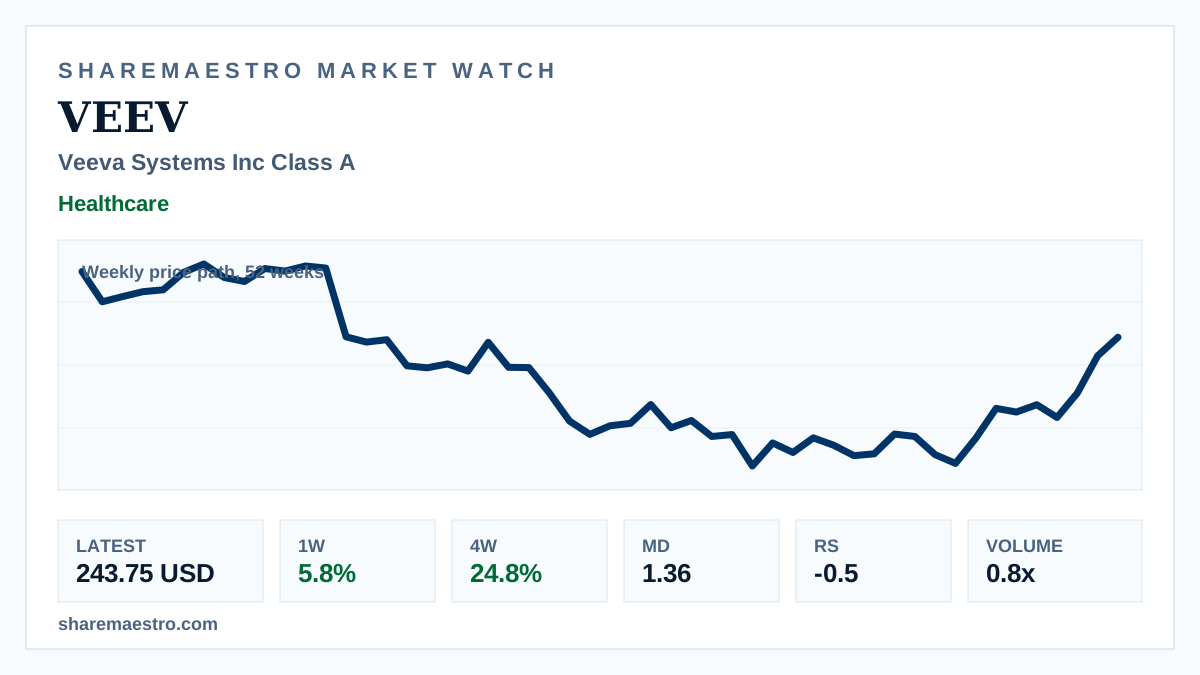
Veeva Systems Inc Class A (VEEV) closed at 243.75 USD in the latest weekly reading, adding 5.8% over one week and 24.8% over four weeks. The chart shows the weekly price path over 52 weeks, placing the move in longer-term context rather than live intraday trading.

Market Dynamics registered 1.36 as confirmation and the trend signal remained active. The complicating evidence is participation: volume was 9.2 million shares versus a 13-week average of 10.9 million, while Relative Strength stood at -0.5.

Continue your research

Explore VEEV across Sharemaestro

These links are shown because current Sharemaestro data is available for this company.

Evidence context