Weekly signal · WSM · Consumer Cyclical

Williams-Sonoma Inc (WSM) rallies 10.1% in weekly context

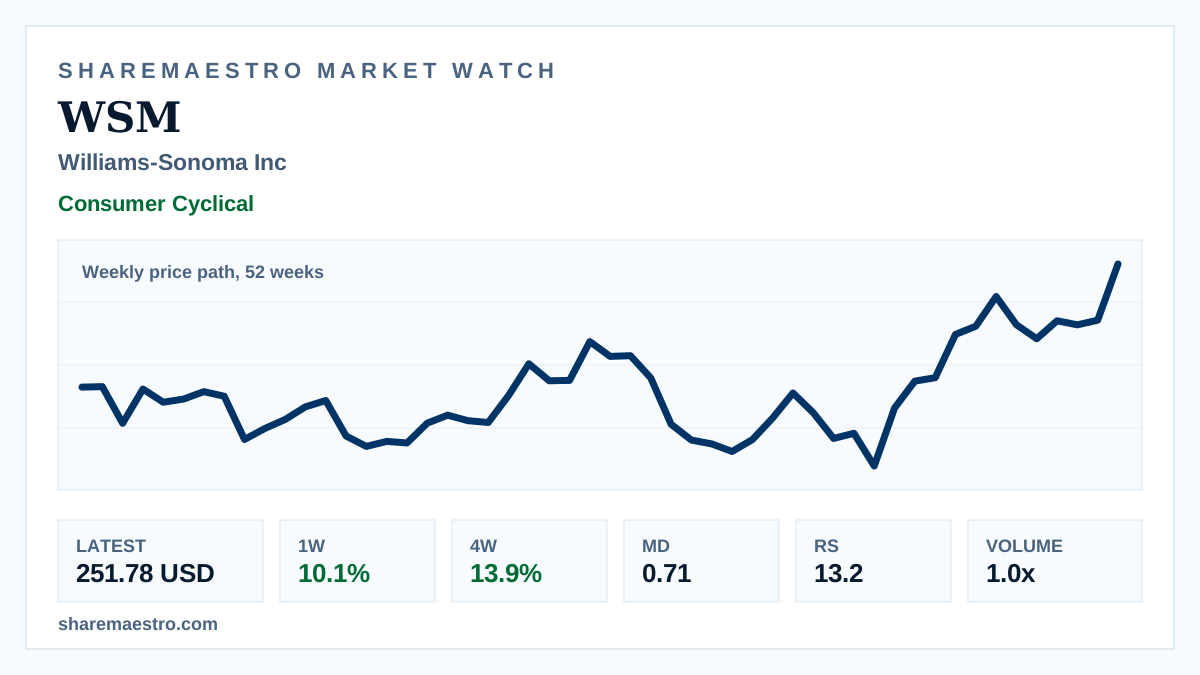
The specialty retailer’s latest close keeps the 52-week setup firm, with medium-term performance still stronger than the latest turnover picture.

Latest251.78 USD
1W move10.1%
Volume1.0x
TrendActive
Weekly market chart for Williams-Sonoma with home retail merchandise in the background.
Supporting market chart for Williams-Sonoma Inc (WSM) rallies 10.1% in weekly context

Market update

What happened

Williams-Sonoma Inc (WSM) finished the latest week at 251.78 USD, up 10.1% for the period. The weekly price path over 52 weeks shows the consumer-cyclical retailer extending a larger advance rather than a one-session move.

The confirming evidence is constructive but not uniform. The trend signal is active and Market Dynamics shows confirmation at 0.71, while weekly volume of 5.4 million shares was roughly in line with the 13-week average of 5.5 million.

Continue your research

Explore WSM across Sharemaestro

These links are shown because current Sharemaestro data is available for this company.

Evidence context