Weekly signal · WDAY · Technology

Workday Inc (WDAY) rebound runs into weak relative-strength check

The application-software stock advanced across the latest one-, four- and twelve-week windows, while confirmation readings remained mixed.

Latest179.64 USD
1W move12.0%
Volume0.7x
TrendInactive
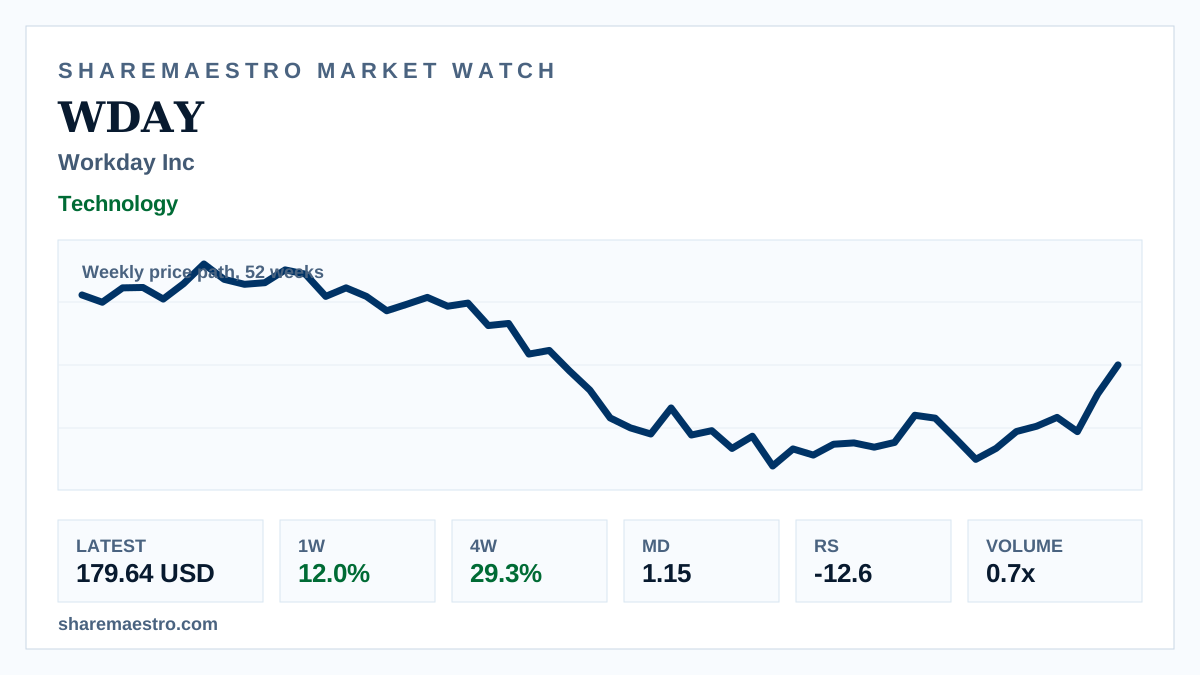
Weekly price chart for Workday Inc shares over 52 weeks.
Supporting market chart for Workday Inc (WDAY) rebound runs into weak relative-strength check

Market update

What happened

Workday Inc (WDAY) closed the latest week at 179.64 USD, rising 12.0% for the week and 29.3% over four weeks. The chart shows weekly price path over 52 weeks, placing the move in weekly context rather than live intraday trading.

Confirmation is not uniform. The trend signal remains inactive, Relative Strength is -12.6, and Market Dynamics shows improvement at 1.15, while weekly turnover stayed below its 13-week average.

Continue your research

Explore WDAY across Sharemaestro

These links are shown because current Sharemaestro data is available for this company.

Evidence context