Weekly signal · FTNT · Technology

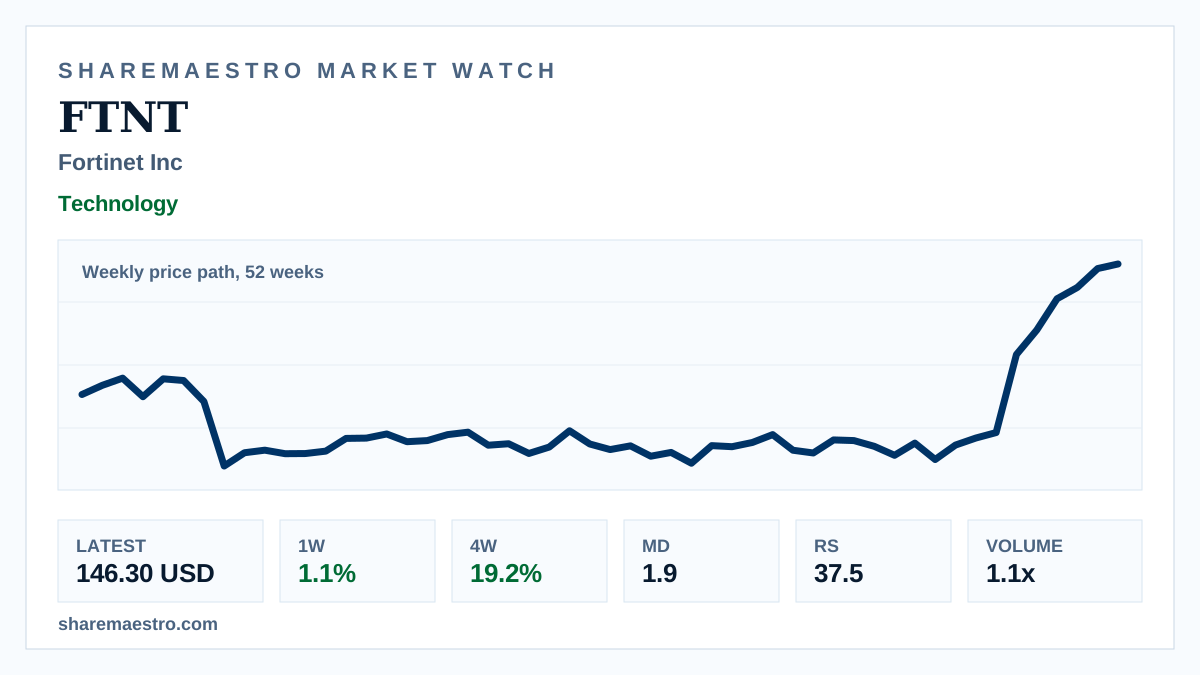
Fortinet Inc (FTNT) keeps active weekly trend after 79.7% 12-week climb

The cybersecurity software stock’s latest move was modest, while confirmation metrics and turnover leave the weekly picture firm but not one-sided.

Latest146.30 USD
1W move1.1%
Volume1.1x
TrendActive
Cybersecurity operations screens and firewall hardware representing Fortinet’s software infrastructure business.
Supporting market chart for Fortinet Inc (FTNT) keeps active weekly trend after 79.7% 12-week climb

Market update

What happened

Fortinet Inc (FTNT) closed the latest week at 146.30 USD, up 1.1%, keeping its active weekly trend in place for the Nasdaq-listed infrastructure software name.

The broader move remains stronger than the latest week alone suggests, with a 19.2% four-week return. Confirmation is mixed: Market Dynamics pressure is positive at 1.9, while Relative Strength stands at 37.5.

Weekly turnover was 31.9 million shares versus a 13-week average of 30.4 million. The chart is a weekly price path over 52 weeks, so the visual context is longer-term rather than live intraday action.

Continue your research

Explore FTNT across Sharemaestro

These links are shown because current Sharemaestro data is available for this company.

Evidence context