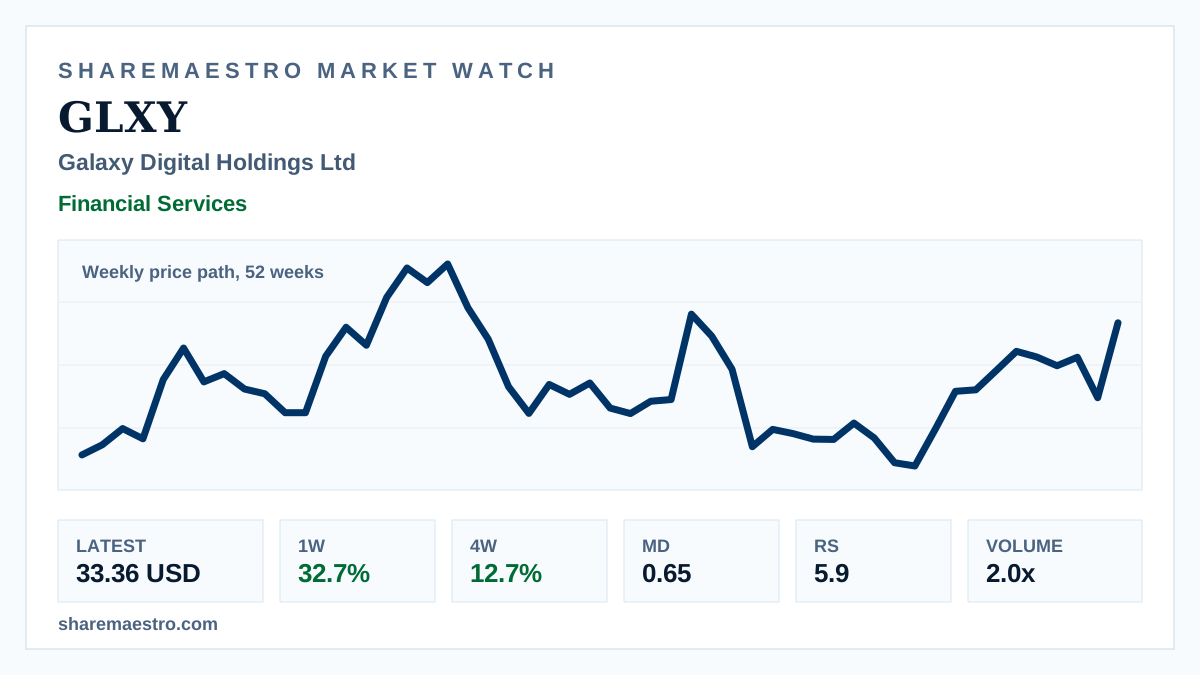
Weekly signal · GLXY · Financial Services

Galaxy Digital Holdings Ltd (GLXY) extends 12-week advance to 61.0%

The digital-asset capital-markets firm showed active trend support as weekly participation ran above its recent average.

Latest33.36 USD
1W move32.7%
Volume2.0x
TrendActive
Financial markets screen showing weekly chart context for Galaxy Digital.
Supporting market chart for Galaxy Digital Holdings Ltd (GLXY) extends 12-week advance to 61.0%

Market update

What happened

Galaxy Digital Holdings Ltd (GLXY) closed at 33.36 USD for the week ended June 12 after a 32.7% one-week rise. In weekly context, the chart shows the price path over 52 weeks rather than live intraday action.

The advance had confirmation from an active trend state, positive Market Dynamics pressure and Relative Strength of 5.9. Turnover was elevated at 57.5 million shares, compared with a 29.2 million 13-week average, while the four-week return stood at 12.7%.

Continue your research

Explore GLXY across Sharemaestro

These links are shown because current Sharemaestro data is available for this company.

Evidence context