Weekly signal · GLXY · Financial Services

Galaxy Digital Holdings Ltd (GLXY) surges 32.7% in heavy weekly trade

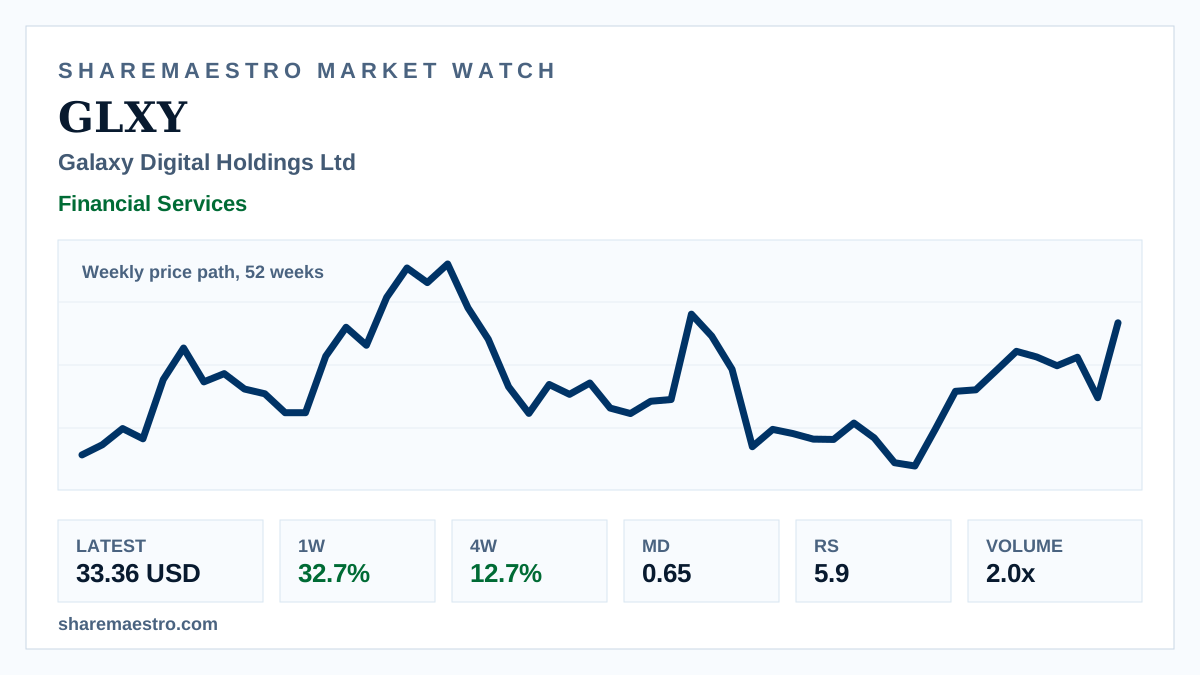
The financial-services stock closed at 33.36 USD, with the 52-week weekly chart showing a sharp extension rather than intraday price action.

Latest33.36 USD
1W move32.7%
Volume2.0x
TrendActive
Market terminal view of a weekly stock chart and volume panel for Galaxy Digital.
Supporting market chart for Galaxy Digital Holdings Ltd (GLXY) surges 32.7% in heavy weekly trade

Market update

What happened

Galaxy Digital Holdings Ltd (GLXY) rose 32.7% for the week ended June 12, closing at 33.36 USD as turnover reached 57.5 million shares. The move added to a 12.7% four-week gain and a 61.0% twelve-week advance.

Confirmation was broad but not one-sided. The trend signal remains active, Market Dynamics showed supportive pressure at 0.65, and Relative Strength stood at 5.9, while the latest close sat above the 26.18 USD fair-value reading.

Continue your research

Explore GLXY across Sharemaestro

These links are shown because current Sharemaestro data is available for this company.

Evidence context