Weekly signal · GFI · Basic Materials

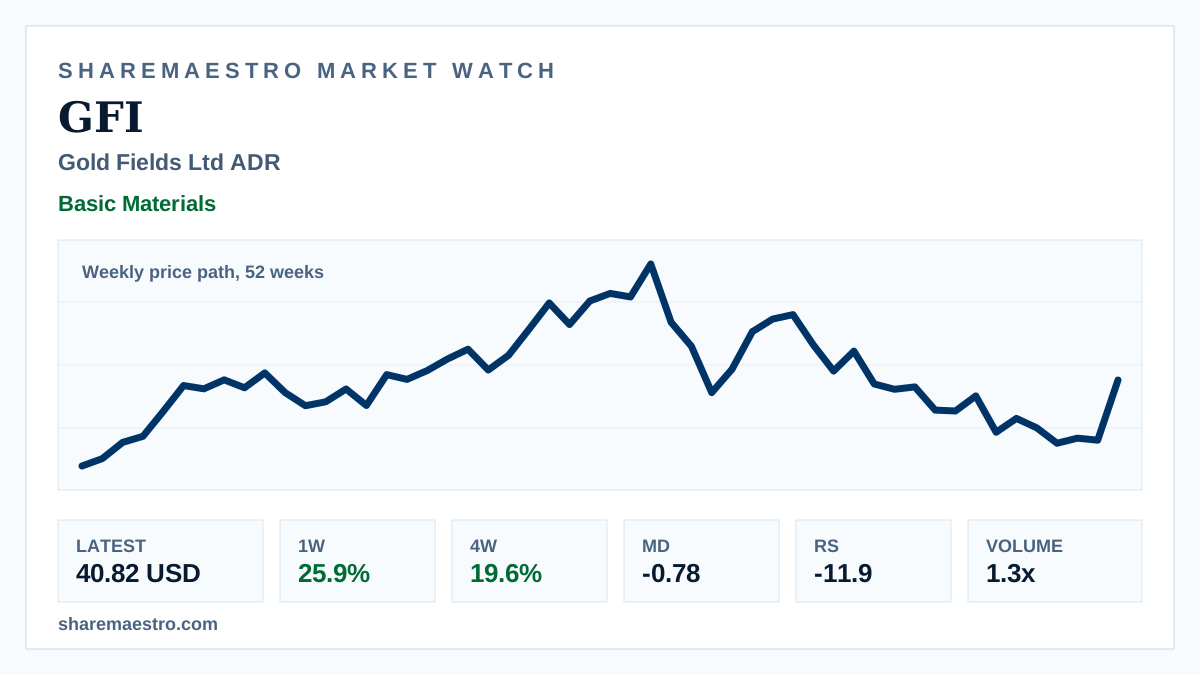
Gold Fields Ltd ADR (GFI) breaks higher on above-average weekly volume

The gold producer’s ADR has regained short-term momentum, but confirmation remains mixed across trend and strength measures.

Latest40.82 USD
1W move25.9%
Volume1.3x
TrendInactive
Weekly 52-week market chart context for Gold Fields Ltd ADR with gold-mining industry visuals.
Supporting market chart for Gold Fields Ltd ADR (GFI) breaks higher on above-average weekly volume

Market update

What happened

Gold Fields Ltd ADR (GFI) advanced on the weekly price path over 52 weeks, standing out on the active weekly screen for both price action and participation. The move came in the Basic Materials sector, where the company’s gold exposure remains the central market driver.

The setup is not fully confirmed. The trend signal is inactive, Market Dynamics shows pressure, and Relative Strength is still negative, leaving the rally ahead of several supporting measures.

Continue your research

Explore GFI across Sharemaestro

These links are shown because current Sharemaestro data is available for this company.

Evidence context