Weekly signal · CIB · Financial Services

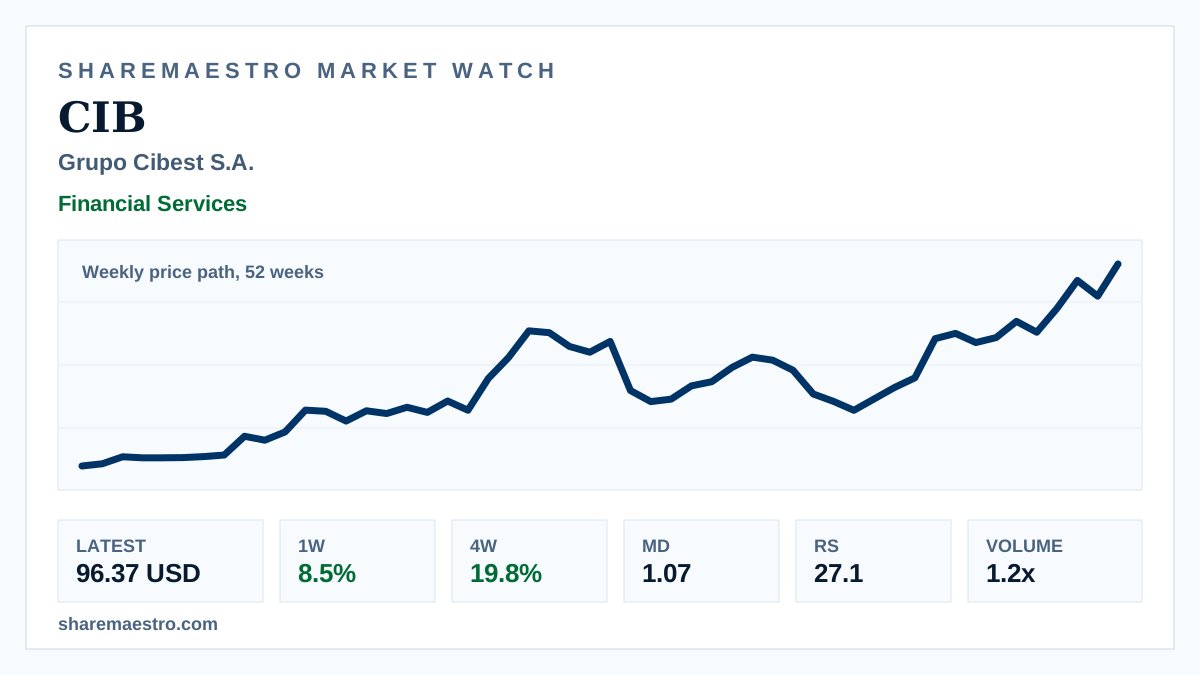
Grupo Cibest S.A (CIB) advances 48.7% over twelve weeks as volume improves

The regional bank’s active weekly trend has drawn firmer participation, while Relative Strength still leaves the signal set short of clean leadership.

Latest96.37 USD
1W move8.5%
Volume1.2x
TrendActive
Weekly market chart and banking imagery for Grupo Cibest S.A.
Supporting market chart for Grupo Cibest S.A (CIB) advances 48.7% over twelve weeks as volume improves

Market update

What happened

Grupo Cibest S.A (CIB) closed the week ended Aug. 14 at 96.37 USD, rising 8.5% for the week. The chart is a weekly price path over 52 weeks, so it frames the move in weekly context rather than live intraday action.

The gain followed a 19.8% four-week return, and the latest active-mover screen showed a 1.5x volume ratio. Market Dynamics at 1.07 added confirmation, while Relative Strength at 27.1 kept the broader reading mixed.

Continue your research

Explore CIB across Sharemaestro

These links are shown because current Sharemaestro data is available for this company.

Evidence context