Volume surge · INSM · Healthcare

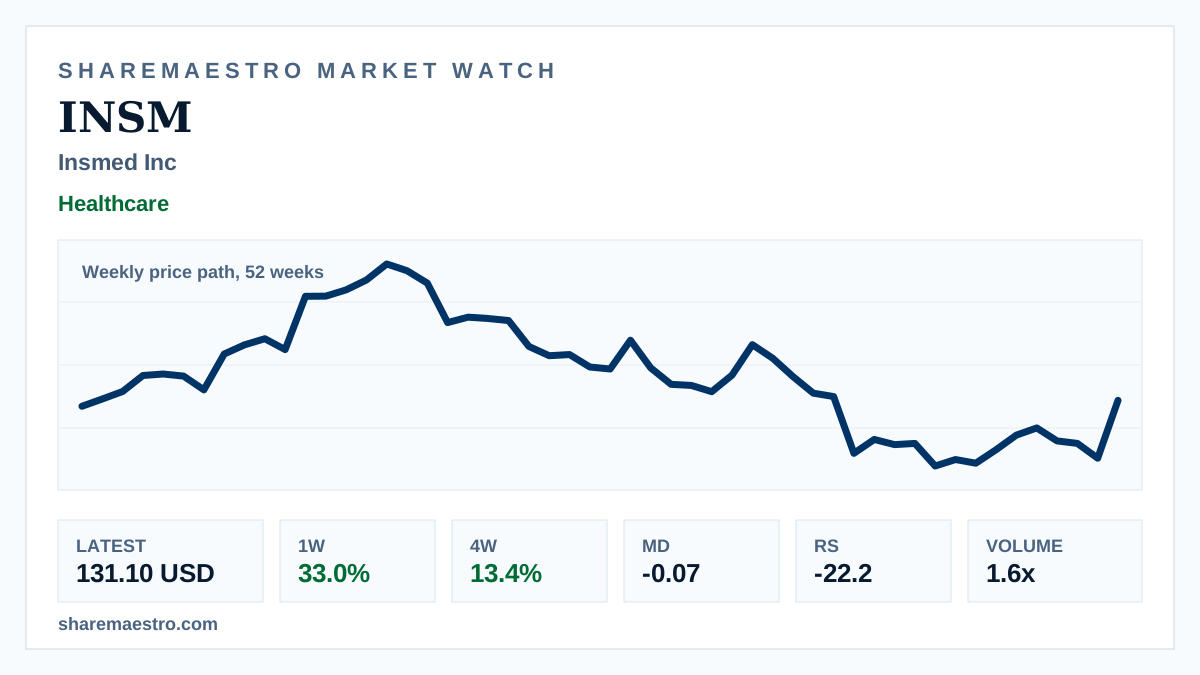
Insmed Inc (INSM) posts 33.0% weekly gain with turnover at 2.4x

The biotechnology stock’s 52-week weekly chart shows a sharp advance, but trend confirmation and relative-strength readings remain mixed.

Latest131.10 USD
1W move33.0%
Volume1.6x
TrendInactive
Biotechnology lab and market-data screen representing Insmed weekly stock activity.
Supporting market chart for Insmed Inc (INSM) posts 33.0% weekly gain with turnover at 2.4x

Market update

What happened

Insmed Inc (INSM) closed the week at 131.10 USD, up 33.0% for the week, with the active-mover screen showing volume at 2.4x normal. The move lifted the stock’s four-week return to 13.4% and its twelve-week return to 20.1%.

Confirmation is not uniform. The trend signal is inactive, Market Dynamics show mild pressure at -0.07, and Relative Strength stands at -22.2, leaving the weekly context stronger on price and volume than on technical breadth.

The 52-week weekly price path frames the move as a biotechnology advance in a Healthcare name with a market value of about $23.1 billion.

Continue your research

Explore INSM across Sharemaestro

These links are shown because current Sharemaestro data is available for this company.

Evidence context