Market update
What happened
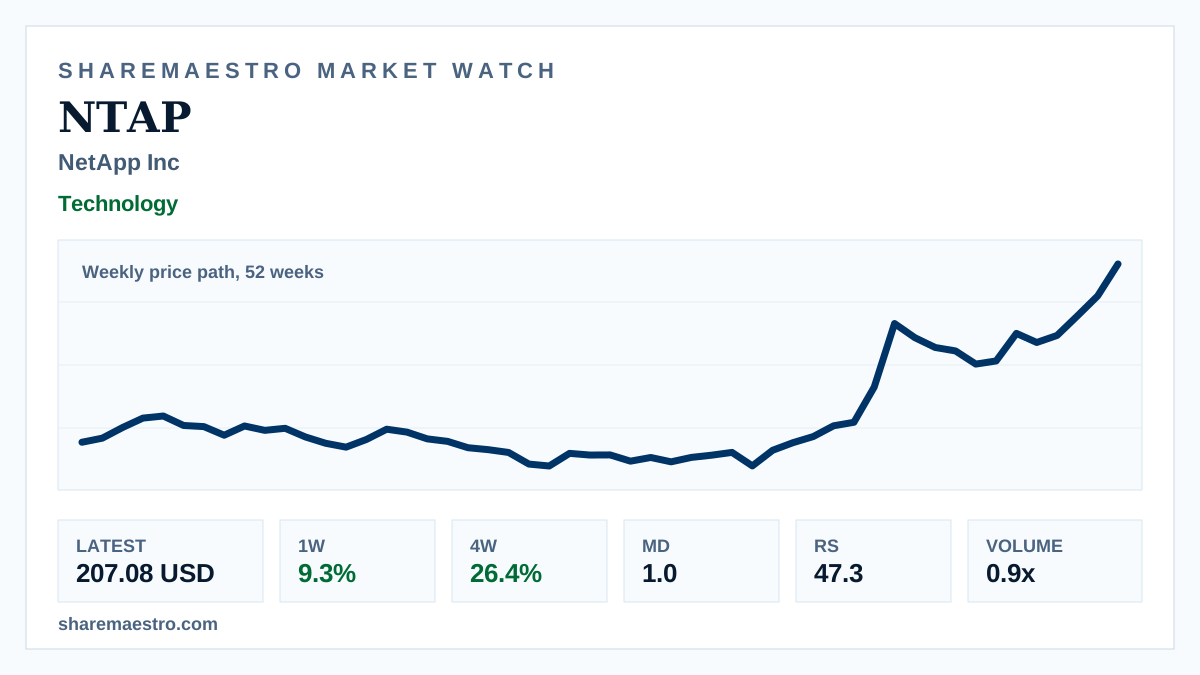
NetApp Inc (NTAP) closed at $207.08 in the latest weekly screen, adding 9.3% for the week and extending its four-week gain to 26.4%. The move leaves the Technology-sector name up 48.6% over 12 weeks.
The chart is a weekly price path over 52 weeks, so it frames the advance as broader weekly context rather than intraday trading. The trend signal is active and Market Dynamics shows confirmation, while Relative Strength stands at 47.3.
The main complication is participation: weekly volume was 13.5 million shares versus a 13-week average of 15.7 million. NetApp’s market value is about $34.5 billion, keeping the move in large-cap software-infrastructure territory.