Intraday mover ยท NOK ยท Technology

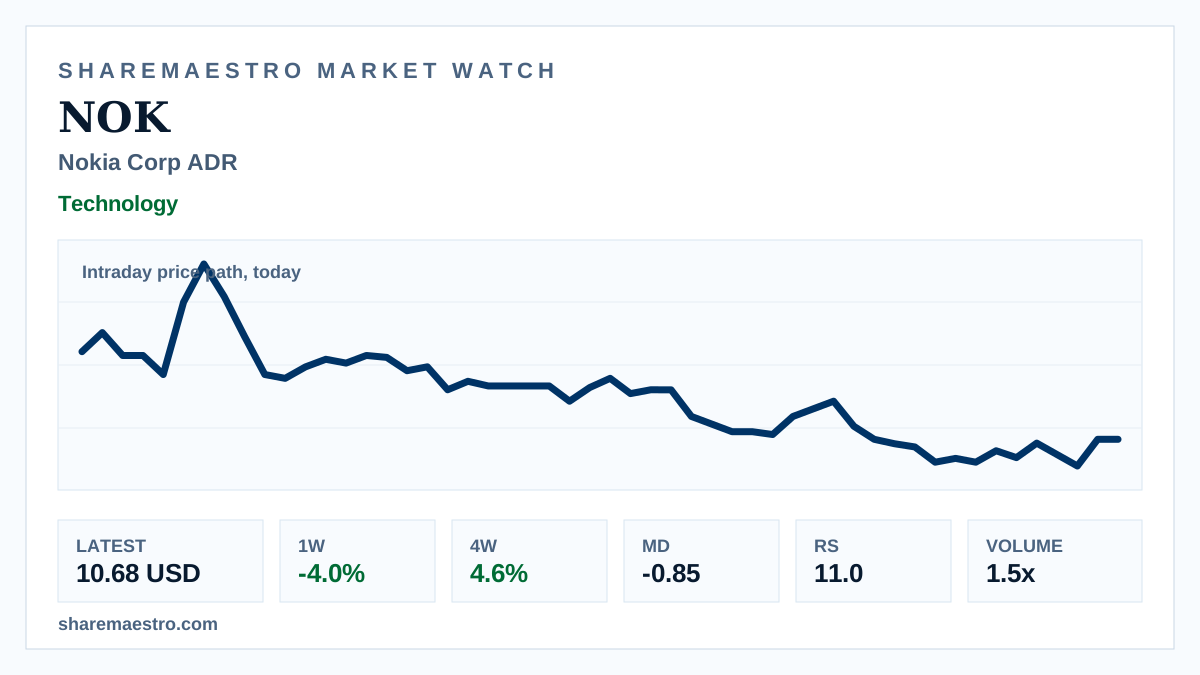
Nokia Corp ADR (NOK) slips 0.9% on active screen with pressure negative

The move keeps attention on a weak 12-week tape, even though the ADR is still positive over the past four weeks.

Latest10.68 USD
1W move-4.0%
Volume1.5x
TrendInactive
Nokia Corp ADR intraday chart shown with communication-network equipment.
Supporting market chart for Nokia Corp ADR (NOK) slips 0.9% on active screen with pressure negative

Market update

What happened

Nokia Corp ADR (NOK) moved lower on the active-mover screen, with market data showing a 0.9% decline. The today intraday price path showed the ADR slipping from 10.75 USD to about 10.64 USD, leaving it down roughly 1.1% in that window.

The confirming evidence is technical rather than dramatic: the trend signal is inactive and Market Dynamics show pressure at -0.85. Weekly market data are mixed, with a latest close of 10.68 USD and a 4.6% four-week return set against weaker one-week and twelve-week readings.

Continue your research

Explore NOK across Sharemaestro

These links are shown because current Sharemaestro data is available for this company.

Evidence context