Weekly signal · OKTA · Technology

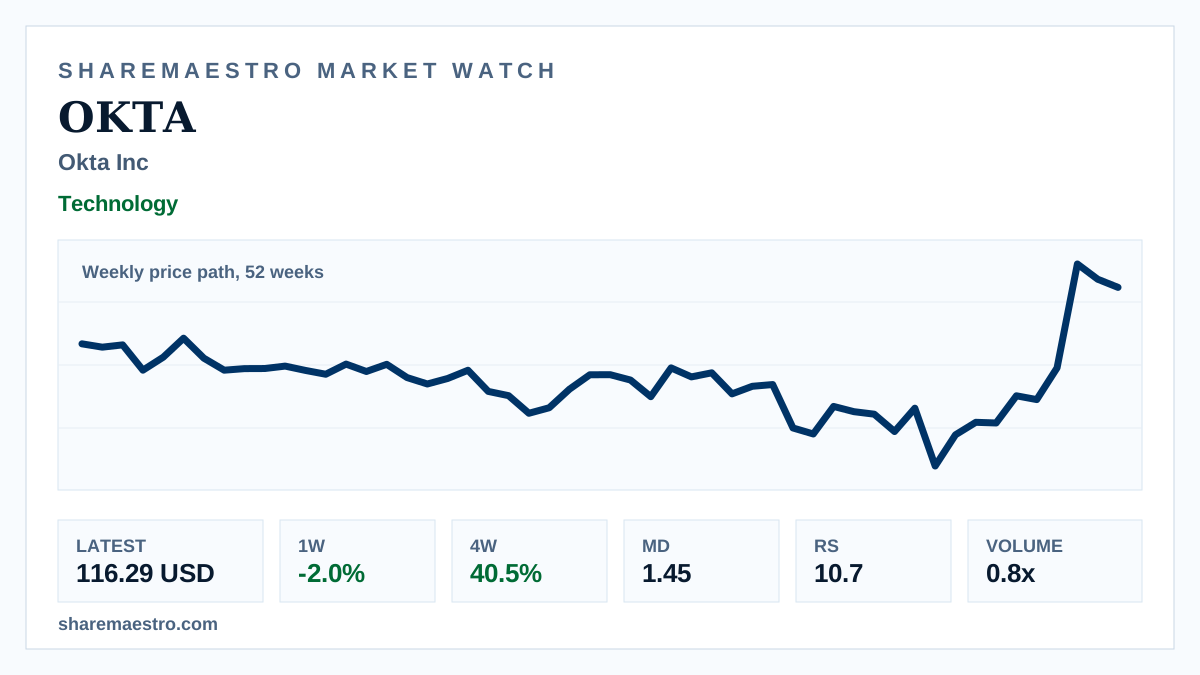
Okta Inc (OKTA) slips 2.0% after a 40.5% four-week run

The weekly pause matters because longer-window momentum is still strong while participation cooled versus recent averages.

Latest116.29 USD
1W move-2.0%
Volume0.8x
TrendActive
Enterprise cybersecurity and identity-management dashboards on a market data desk.
Supporting market chart for Okta Inc (OKTA) slips 2.0% after a 40.5% four-week run

Market update

What happened

Okta Inc (OKTA) closed the latest week at 116.29 USD, down 2.0%, trimming a sharp move that has left the software-infrastructure stock up 40.5% over four weeks.

The confirming evidence is still constructive: the weekly trend signal remains active, Market Dynamics shows confirmation at 1.45, and Relative Strength stands at 10.7. The complication is volume, with 15.7 million shares traded versus a 13-week average of 19.5 million.

The chart shows a weekly price path over 52 weeks, so the setup is best read as weekly context rather than live intraday action.

Continue your research

Explore OKTA across Sharemaestro

These links are shown because current Sharemaestro data is available for this company.

Evidence context