Weekly signal · QXO · Industrials

QXO, Inc. (QXO) rebound meets inactive trend confirmation

The industrial-distribution stock jumped over the latest week, but medium-term readings still leave the setup mixed.

Latest16.16 USD
1W move21.5%
Volume1.0x
TrendInactive
Weekly market chart context for QXO, Inc. with industrial distribution warehouse equipment.
Supporting market chart for QXO, Inc. (QXO) rebound meets inactive trend confirmation

Market update

What happened

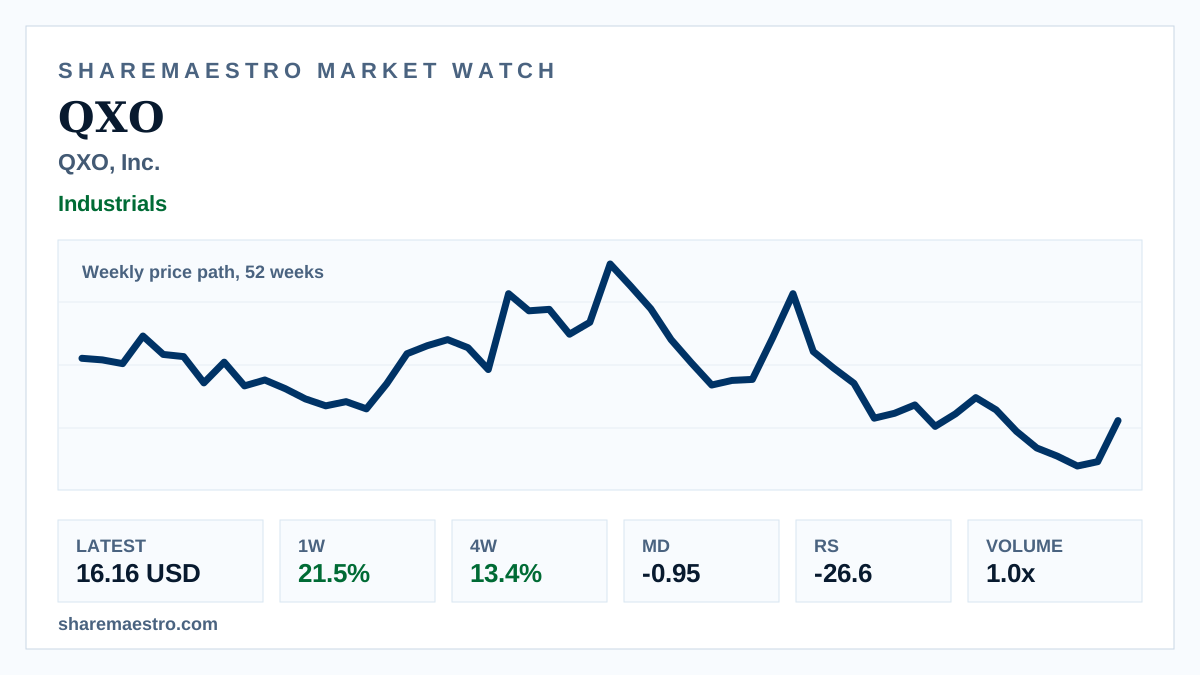
QXO, Inc. (QXO) closed the week ended Aug. 7, 2026, at 16.16 USD, rising 21.5% in weekly market data. The chart shows a weekly price path over 52 weeks, not live intraday trading.

The move improved the four-week return to 13.4%, while the twelve-week return remained slightly negative at -1.0%. Confirmation was limited, with the trend signal inactive, Market Dynamics showing pressure at -0.95, and Relative Strength at -26.6.

Turnover was heavy in absolute terms but close to recent norms: 104.1 million shares for the latest week versus a 13-week average of 106.6 million.

Continue your research

Explore QXO across Sharemaestro

These links are shown because current Sharemaestro data is available for this company.

Evidence context