Weekly signal · SN · Consumer Cyclical

SharkNinja (SN) stalls near $185 after a 19.8% four-week run

The appliance maker’s weekly trend remains active, but the latest return and Relative Strength reading point to a more mixed setup.

Latest185.10 USD
1W move-0.2%
Volume1.0x
TrendActive
SharkNinja appliances beside a market-data screen with weekly stock-chart visuals.
Supporting market chart for SharkNinja (SN) stalls near $185 after a 19.8% four-week run

Market update

What happened

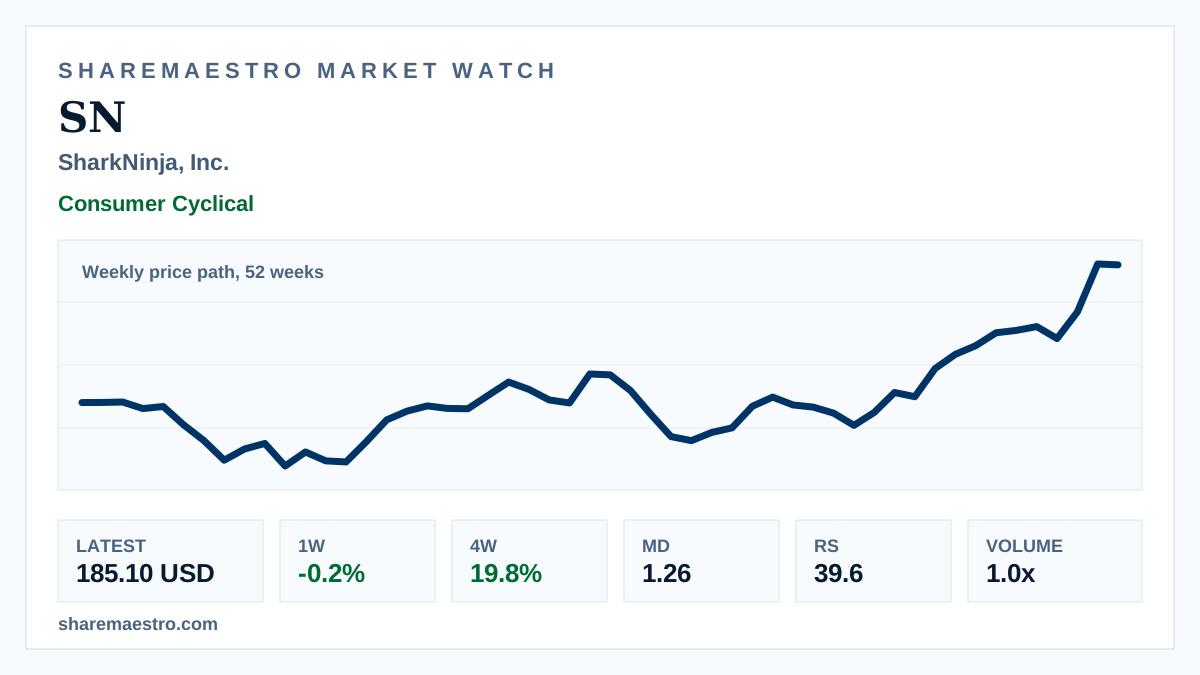
SharkNinja (SN) closed the latest week at $185.10, slipping 0.2% even after a 19.8% four-week gain. The stock remains up 65.2% over twelve weeks, keeping the longer weekly move intact.

The chart shows a weekly price path over 52 weeks, placing the latest pause in broader context rather than live intraday action. Market Dynamics at 1.26 adds confirmation, while Relative Strength of 39.6 and volume near its 13-week average make the reading mixed.

Continue your research

Explore SN across Sharemaestro

These links are shown because current Sharemaestro data is available for this company.

Evidence context