Market update
What happened
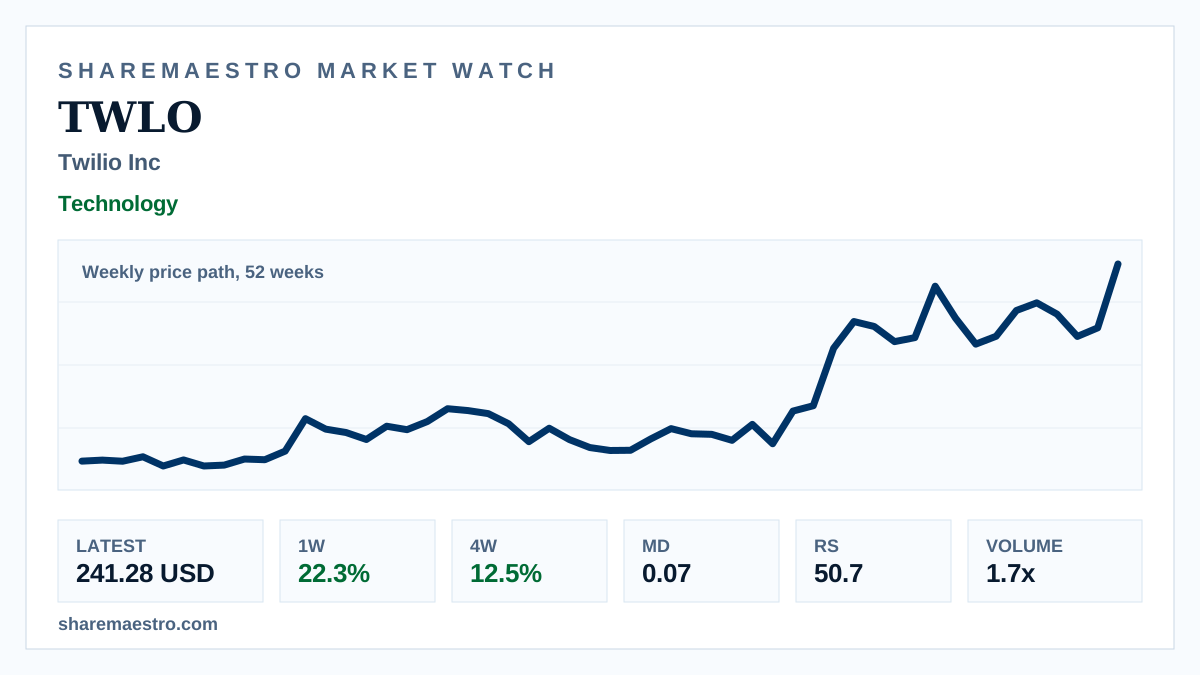
Twilio Inc (TWLO) closed the latest week at 241.28 USD, a 22.3% rise that put the cloud-communications software stock back on the active-mover screen.
The confirming evidence is mainly participation: turnover ran at 2.9x on the weekly screen. The complication is that Market Dynamics at 0.07 showed only light confirmation, so the rally was supported more by activity than by broad technical pressure.
The chart window is the weekly price path over 52 weeks, not a live intraday trace. Separate intraday data showed the stock at 245.755 USD, down 3.7% from a 255.13 USD start on 29,022 shares.