Volume surge · WDAY · Technology

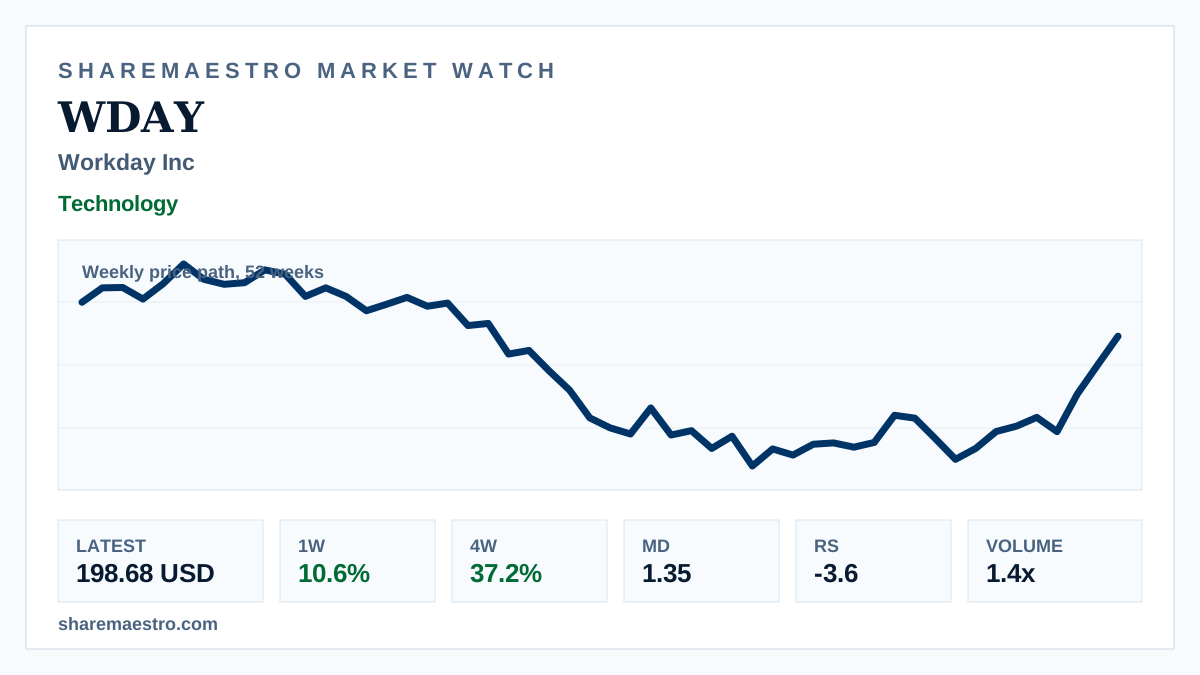
Workday Inc (WDAY) sees volume swell as weekly rebound gains force

The software stock’s weekly setup is improving, but negative relative strength keeps the readings mixed.

Latest198.68 USD
1W move10.6%
Volume1.4x
TrendActive
Weekly market chart context for Workday shares with price and volume indicators.
Supporting market chart for Workday Inc (WDAY) sees volume swell as weekly rebound gains force

Market update

What happened

Workday Inc (WDAY) closed the latest week at 198.68 USD, up 10.6% for the week as the four-week gain reached 37.2%. The 12-week advance now stands at 55.0%, putting the move in a broader weekly recovery rather than a one-week spike.

The weekly price path over 52 weeks is backed by heavier trading, with 36.5 million shares changing hands versus a 13-week average of 25.3 million. Trend state is active and Market Dynamics show confirmation at 1.35, while Relative Strength remains negative at -3.6, leaving the evidence constructive but mixed.

Continue your research

Explore WDAY across Sharemaestro

These links are shown because current Sharemaestro data is available for this company.

Evidence context