Intraday mover · AAL · Industrials

American Airlines Group (AAL) trades lower on the active tape

The airline’s near-term move softened even as recent weekly returns still show a sharp rebound from earlier levels.

Latest14.98 USD
1W move11.0%
Volume2.1x
TrendInactive
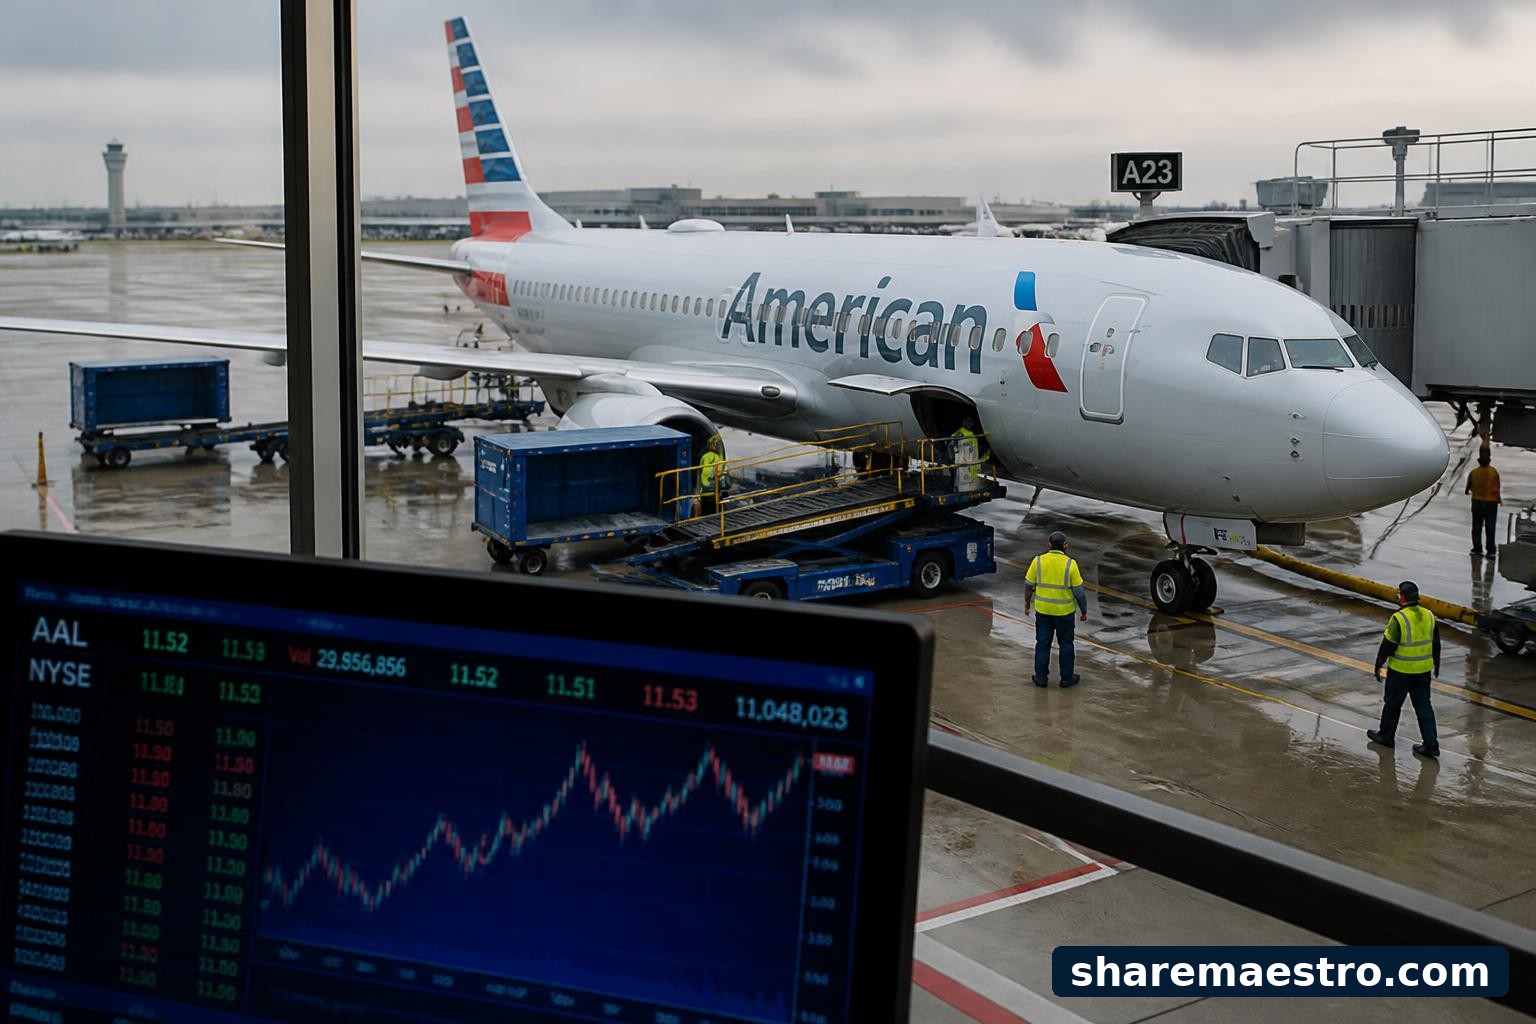
American Airlines jet at an airport gate with market data shown on a terminal screen.
Supporting market chart for American Airlines Group (AAL) trades lower on the active tape

Market update

What happened

American Airlines Group (AAL) fell 1.8% to $15.42 on the active-mover screen, with turnover at 129.9 million shares. The move put the Fort Worth-based airline among the day’s more heavily traded large-cap industrial names.

The latest weekly market data show a $14.98 close for the week ended June 12, with gains of 11.0% over one week, 21.7% over four weeks, and 43.6% over twelve weeks. Confirmation is mixed: Market Dynamics remains positive at 0.87, while the trend signal is inactive and Relative Strength is negative at -2.1.

Continue your research

Explore AAL across Sharemaestro

These links are shown because current Sharemaestro data is available for this company.

Evidence context