Market update
What happened
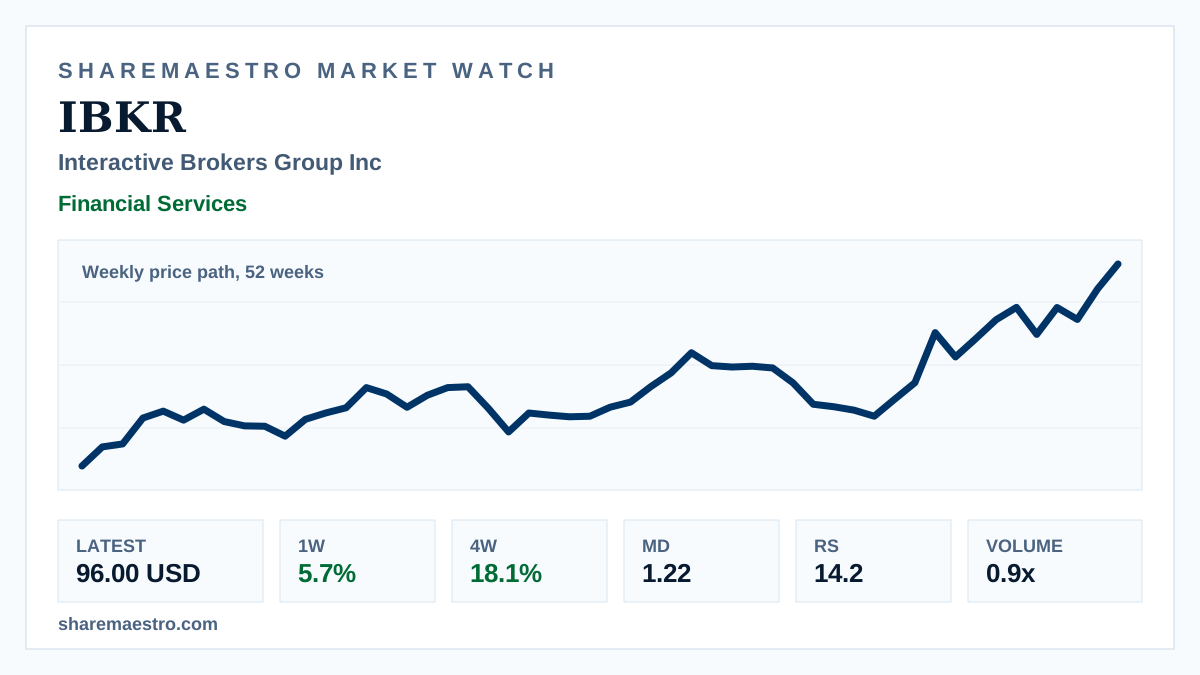
Interactive Brokers Group Inc (IBKR) closed the week ended June 19 at 96.00 USD, up 5.7% for the week. The 52-week weekly price path shows the stock continuing to build on its spring advance.
Confirmation remains constructive: the trend signal is active and Market Dynamics stands at 1.22. The main caveat is participation, with 20.3 million shares traded versus a 13-week average of 23.7 million.