Weekly signal ยท MSTR ยท Technology

MicroStrategy Incorporated (MSTR) loses weekly traction with trend inactive

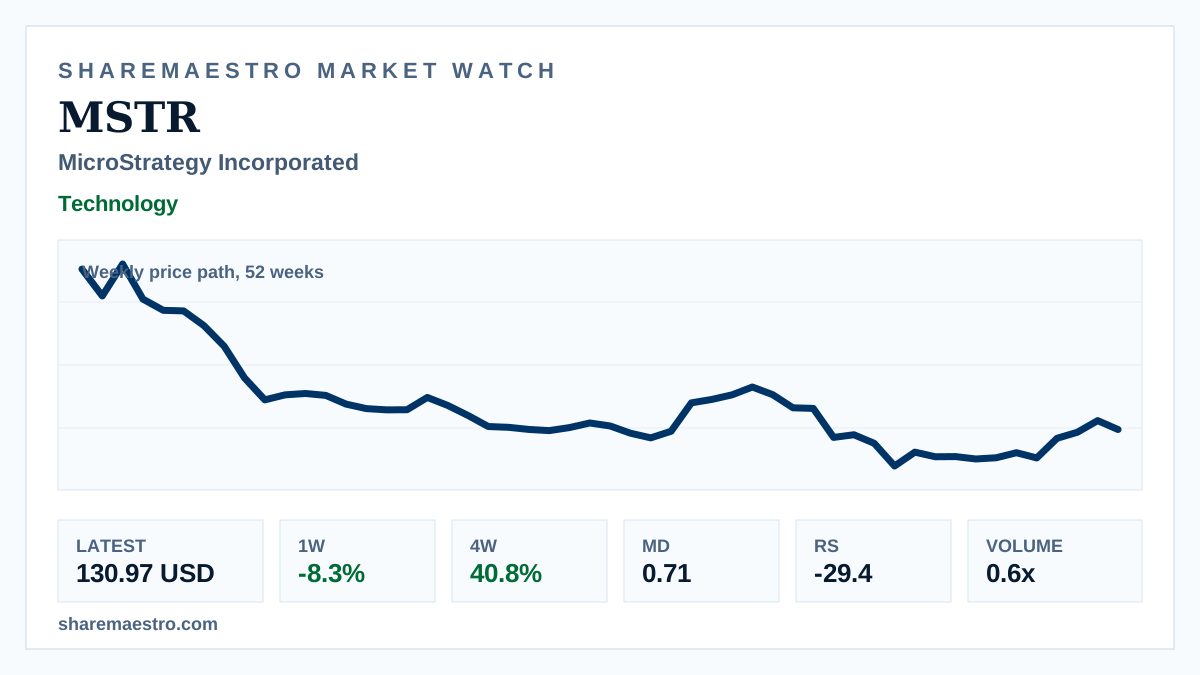
The 52-week weekly price path frames the move as a pullback inside a still-positive one-month run, leaving the setup mixed.

Latest130.97 USD
1W move-8.3%
Volume0.6x
TrendInactive
Weekly stock chart and market data dashboard for MicroStrategy.
Supporting market chart for MicroStrategy Incorporated (MSTR) loses weekly traction with trend inactive

Market update

What happened

MicroStrategy Incorporated (MSTR) closed the latest week at 130.97 USD, posting a -8.3% one-week return in weekly context.

The reversal is complicated by a 40.8% four-week return and a 16.4% twelve-week return. The trend signal is inactive, Relative Strength sits at -29.4, and Market Dynamics at 0.71 offers limited confirmation while volume stayed below its 13-week average.

Continue your research

Explore MSTR across Sharemaestro

These links are shown because current Sharemaestro data is available for this company.

Evidence context