Market update
What happened
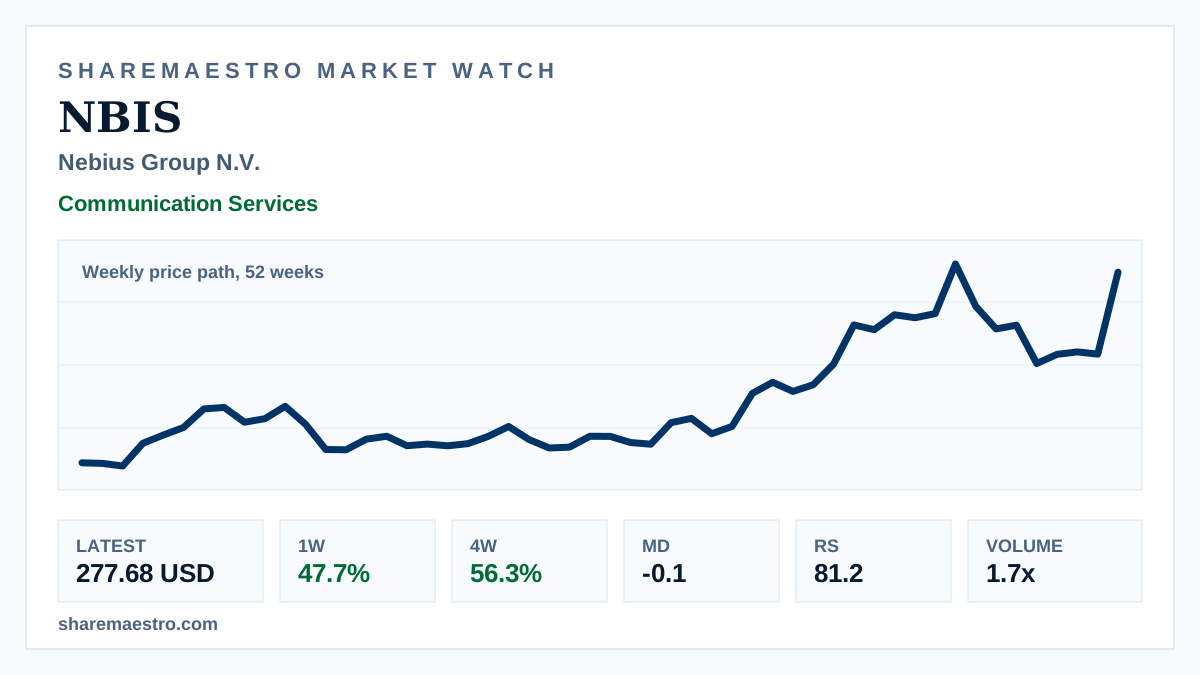
Nebius Group N.V. (NBIS) closed the latest week at 277.68 USD, up 47.7% for the week in weekly market data. The NASDAQ-listed internet content and information stock also shows a 56.3% four-week gain and a 29.3% twelve-week advance.
Confirmation came from activity and relative performance. Volume reached 167.5 million shares, about 1.7 times the 13-week average, while Relative Strength stood at 81.2 and the trend signal remained active.
The weekly price path over 52 weeks shows the move in longer-term context rather than live intraday action. Market Dynamics at -0.1 points to slight pressure, leaving the readings strong but not uniformly positive.