Volume surge ยท TWLO ยท Technology

Twilio Inc (TWLO) sees 7.3% week as trading runs above trend

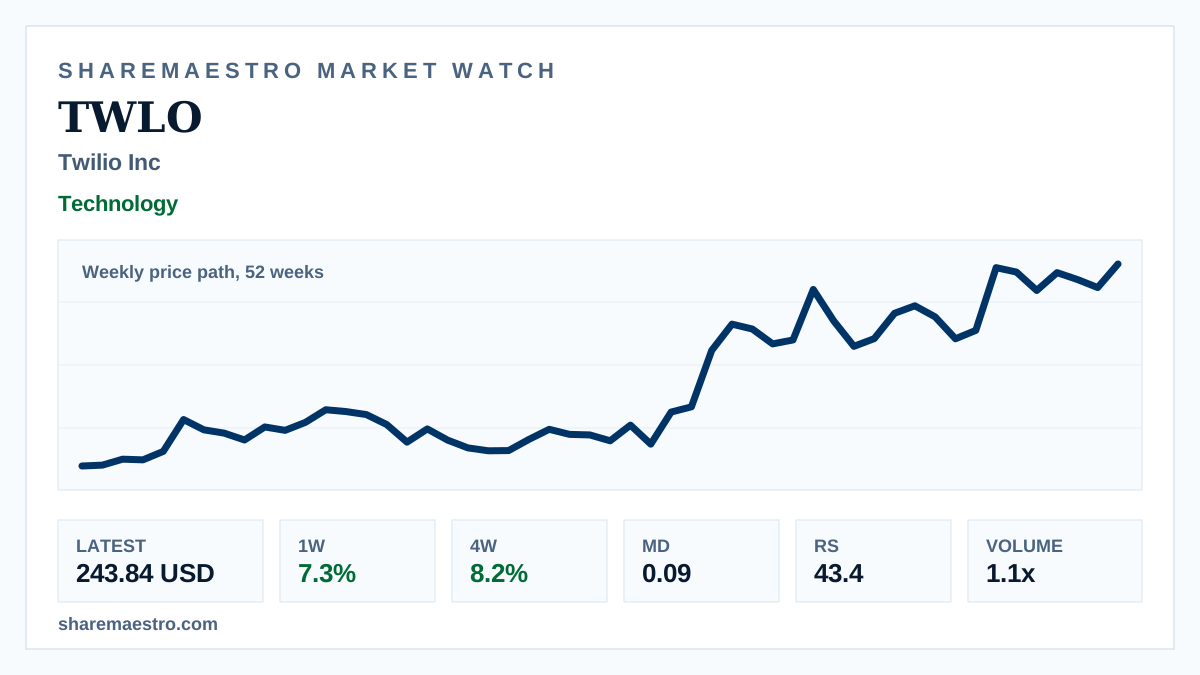
The weekly 52-week chart context shows the cloud-communications stock adding to a 27.3% 12-week advance, with confirmation readings positive but mixed.

Latest243.84 USD
1W move7.3%
Volume1.1x
TrendActive
Weekly chart context for Twilio Inc stock with price path and volume bars.
Supporting market chart for Twilio Inc (TWLO) sees 7.3% week as trading runs above trend

Market update

What happened

Twilio Inc (TWLO) closed at 243.84 USD for the week ended Sept. 18, rising 7.3% in the weekly price path over 52 weeks. The four-week gain reached 8.2%, extending a 27.3% twelve-week advance.

Turnover supported the move, with 11.5 million shares traded versus a 13-week average of about 10.0 million; the active-mover screen also flagged volume at 1.9x. The trend signal is active and Market Dynamics shows mild confirmation at 0.09, while Relative Strength at 43.4 keeps the reading constructive but mixed.

Continue your research

Explore TWLO across Sharemaestro

These links are shown because current Sharemaestro data is available for this company.

Evidence context